

For many businesses that want to move up the Analytics Maturity Curve , there’s a persistent myth that actionable insights can only emerge from pristine data. Business executives in these companies frequently dismiss their organization’s analytics potential, believing their data is too “dirty” or unreliable to power advanced insights.
The truth, however, is that no dataset is ever perfect. Every organization’s data exists on a spectrum of cleanliness, from highly structured and accurate to chaotic and inconsistent. With the right techniques however, data scientists can extract highly valuable insights, even from flawed datasets. Success lies in understanding the data, preparing it effectively, and validating models rigorously. This final step, Validation, is the key to the whole endeavor. Let’s start at the beginning of the process however, and discuss how these insights are distilled.
Defining the Business Problem
The journey to actionable insights begins with a clear definition of the problem. Without clarity, even the cleanest data and most sophisticated models will fail to deliver meaningful outcomes.
For instance, consider a company aiming to optimize customer acquisition. A well-defined problem might involve predicting which customer segments are most likely to occupy the intersection of maximal profit generation and maximal response rate, vs. simply looking at which ones are most likely to respond to a new marketing campaign. Moreover, diving deeper, spending sufficient time to clearly define what is meant by “profit”, and obtaining consensus on both its calculation and the attribution rules that feed into it are critical. Note that these steps, while foundational, do not involve AI; but instead properly frame the business problem, which in turn helps guide the selection and curation of both independent and dependent variables.
“A problem well stated is half solved”
As the old adage goes, “A problem well stated is half solved.” Starting with the end goal in mind ensures that the subsequent steps—data preparation, model construction, and validation—are all aligned.
Preparing Data for Model Construction
Before diving into model construction, data preparation is critical. Poorly prepared data can skew results, obscure patterns, and undermine the reliability of predictive models. Here are several key steps in data preparation:
1. Handling Outliers
Outliers—extreme values that deviate significantly from the rest of the data—can distort statistical measures and model predictions. Data scientists use techniques such as:
- Winsorization: Capping extreme values at a certain percentile.
- Transformation: Applying logarithmic or square root transformations to minimize the impact of outliers.
- Exclusion: Removing outliers when justified by the context.
2. Addressing Skewness
Many real-world datasets exhibit skewness, where data is unevenly distributed. Left unaddressed, skewness can bias models. Common remedies include:
- Log Transformation: Reducing skewness by compressing larger values.
- Normalization: Scaling data to a uniform range.
- Power Transformation: Adjusting the distribution to approximate normality.
3. Sampling Challenges
Sampling is an essential step, particularly when working with large datasets. However, poor sampling can introduce biases or result in unrepresentative data. To mitigate this:
- Random Sampling ensures each data point has an equal chance of selection.
- Stratified Sampling maintains proportional representation of key subgroups.
- Oversampling addresses imbalances, especially in datasets with rare events, such as fraud detection.
4. Feature Selection and Engineering
Data scientists often eliminate irrelevant variables (features) and create new ones to enhance predictive accuracy. Techniques like Principal Component Analysis (PCA) help reduce dimensionality, while domain knowledge guides the creation of new features that capture meaningful relationships.
Assessing Quality and Building Trust Through Data Sampling & Validation
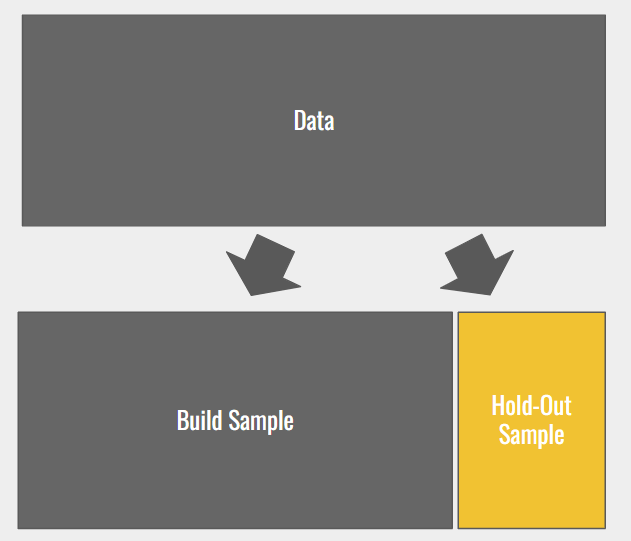
Once the data is prepared, assessing its quality is paramount. This is often achieved through random sampling techniques that split the data into two subsets:
1. Build Sample
The build sample is used to train machine learning or AI models. By exposing the model to historical data, it learns patterns and relationships between inputs (independent variables) and the target output (dependent variable).
2. Holdout Sample
The holdout sample serves as an independent test data set, untouched during model training. The model’s predictions on this sample are compared against actual known outcomes, providing a measure of its predictive accuracy.
The Holdout Sample is the key to providing confidence in the model construction process. When a model that is constructed on the build sample is applied to predict known values within the holdout sample, it becomes easy to see how accurate the model is. If the model does a good job at making accurate predictions within this hold out sample, then one can be reasonably assured that it will continue to do a good job, for a time, on other more general data. More on Model Governance Here. There are several ways to evaluate the accuracy of a model’s predictions:
Validating the Model
Validation ensures that the model is both reliable and generalizable. Key metrics for evaluating performance on the holdout sample include:
1. R-Squared (R²)
A measure of how well the model explains the variance in the data. An R² close to 1 indicates a strong fit, though overly high values can signal overfitting.
2. Mean Absolute Error (MAE) and Mean Squared Error (MSE)
These metrics evaluate the average magnitude of prediction errors. MAE provides a straightforward average, while MSE penalizes larger errors more heavily.
3. Precision, Recall, and F1 Score
For classification problems, these metrics assess the model’s ability to correctly identify positive outcomes while avoiding false positives and negatives.
4. Area Under the Curve (AUC)
In binary classification tasks, the AUC measures the model’s ability to distinguish between classes across various decision thresholds.
5. Residual Analysis
Examining the differences between predicted and actual values can reveal biases or patterns that the model failed to capture.
What Constitutes a “Good” Model in Business?
In business, particularly in financial services, a “good” model doesn’t need to explain all variation in the target variable to deliver significant value. For example, when developing marketing targeting models within financial services, it is not uncommon for a model with an adjusted R-squared of 30% to 40% to be considered sufficiently “good”, and be profitably operationalized. While such models can explain only a minority of the variance (30% – 40%) in the dependent variable, they can still drive millions of dollars in revenue and profit; despite the inaccuracies and other problems that exist in the data that went into building the model.
Finding a Balance
Aligning model performance with organizational risk appetite is one of the most important steps in model operationalization. This involves understanding the balance between predictive power and acceptable risk, ensuring that models deliver value while managing potential downsides effectively. More on this topic here.
“If one’s data is fully and irredeemably flawed or irrelevant, the probability of producing a model with any kind of predictive capacity is exactly zero. Said a different way, if a model is able to account for at least some amount of variation in the dependent variable, then it may be at least partially useful.”
If one’s data is fully and irredeemably flawed or irrelevant, the probability of producing a model with any kind of predictive capacity is exactly zero. Said a different way, if a model is able to account for at least some amount of variation in the dependent variable, then it may be at least partially useful. The level of usefulness will depend on 1) the value a correct prediction delivers to the organization, 2) the cost that an incorrect prediction potentially incurs, and 3) the degree to which a model is able to provide correct predictions. There will always be a cut-off point in model performance, for any given model application, below which organizations are unlikely to be able to profitably deploy a model.
Again, given an organization’s risk appetite, and an understanding of the potential up-side and down-side associated with taking action on a model recommendation, a balance can be struck.
Conclusion
Dirty data is not a dead end—it’s a starting point. By applying robust preparation and validation techniques, organizations can extract meaningful, actionable insights from imperfect datasets. While the journey requires effort and expertise, the rewards—smarter decisions, innovative solutions, and a competitive edge—are well worth the investment.
The challenge lies not in achieving perfection but in applying the right tools and technique capable of sifting through the mess, to find the gold hidden within. With the right approach, even the dirtiest data hold the possibility of being transformed into a powerful tool for driving business success.
About VentureArmor
At VentureArmor, we specialize in helping businesses unlock the power of AI to drive operational excellence and customer satisfaction. Our expertise in AI analytics and data-driven solutions enables us to deliver tailored solutions that meet the unique needs of our clients. Contact us to learn more about how we can help your organization achieve its goals through the strategic application of AI. VentureArmor: Delivering ROI with AI.