How about your competitors, do they have an AI strategy? Most industry leading companies not only have an AI strategy, but they’re taking action on this strategy daily to make smarter decisions, move faster, and operate at a scale no traditional human-led heuristic-based business operating model can match. This means, whether you’ve noticed or not, that your business is likely already going head-to-head trying to compete against best-in-class AI.
So, the real question isn’t if your business needs an AI strategy… It’s how soon can you create one if it don’t already have one?
Still, developing an AI strategy can be challenging. The recent rise of artificial intelligence buzz hasn’t made it any easier; unleashing a tidal wave of headlines, LinkedIn hot takes, and industry news; equal parts hype, hope, and hand-wringing. For many business leaders however, the AI “noise” has blurred the signal.
This guide attempts to strip away the confusion and gets to the heart of what matters. Here, you’ll find a clear and practical framework for building a profitable, risk-adjusted AI strategy; one that answers the questions executives should be asking:
What is AI, really, and what can it do for my business?
Which opportunities should we seize first?
How do we prioritize, build, and deploy AI initiatives effectively?
Most importantly; how do we turn AI into consistent, measurable value while managing risks?
If AI is already reshaping your competitive landscape, the smartest move you can make is to start shaping your own future with it, now.
At its simplest, AI is technology that enables computers and machines to simulate human learning, comprehension, problem solving, decision making, creativity and autonomy. (IBM); learning from data, reasoning through problems, and making decisions. But there’s a lot more to AI than the buzzwords.
Our article, What is AI?, breaks the topic down. It starts by defining AI through multiple lenses, then maps out the landscape, from traditional machine learning and neural networks to cutting-edge reinforcement learning and beyond.
For business leaders, the first step in any AI journey is understanding the tools in the AI toolbox; what they are, how they’re organized, and where they shine. This article serves as your quick, comprehensive primer, giving you the clarity you need to separate hype from reality.
Step 2: Understanding How AI Drives Business Value
AI is a catalyst for transforming how you use data to make decisions.
In our Analytics Maturity Curve article, we explore how organizations can move from simply looking at the past to actively shaping the future. AI powers every step of this journey:
Descriptive Analytics – Summarizes what happened (e.g., last quarter’s sales reports).
Diagnostic Analytics – Reveals why it happened (e.g., connecting a sales drop to operational bottlenecks).
Predictive Analytics – Forecasts what’s likely to happen next (e.g., projecting customer demand).
Prescriptive Analytics – Recommends what to do about it (e.g., fine-tuning pricing for maximum profit).
The further you progress along this curve, the more your analytics shift from passive reporting to proactive, profit-driving action. The payoff? Competitive advantages like hyper-personalized customer experiences, leaner operations, and faster, smarter decision-making; exactly what it takes to win in today’s AI driven market.
Step 3: Build an AI Strategy Aligned with Business Goals
Understanding AI is just the beginning. Turning AI into business value starts with clarity on your goals.
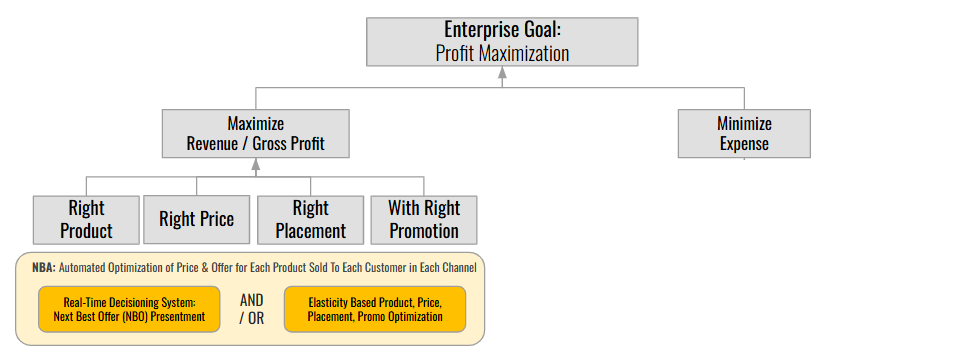
For most for-profit organizations, the ultimate objective is simple: maximize profit. There are only two levers to pull to achieve this:
Maximize Revenue
Minimize Costs
Every AI initiative should connect directly, and obviously, to one of these levers. If a proposed AI project can’t demonstrate a clear path to boosting revenue or cutting costs, its value deserves serious scrutiny.
By grounding your AI strategy in your core business objectives, you ensure every investment drives measurable results—not just technological novelty. Let’s explore each of these in turn:
Maximizing Revenue
For companies selling products or services, AI can be a game-changer for mastering the 4 P’s: Product, Price, Placement, and Promotion.
When attempting to maximize decision making in this domain, companies should focus on analyses that drive two key areas; 1) the likelihood that someone will acquire your product or service, or 2) the value of your product or service (e.g. the amount of money that you make with each sale). Let’s discuss each of these:
Boosting Customer AcquisitionLikelihood AI can supercharge “Next Best Action” strategies (see Article 1 | Article 2) by analyzing the 4 P’s alongside hundreds/thousands of other variables; from customer behavior patterns to shifting market trends. Insights from these analyses ensure that the optimal product is presented to each customer at the optimal price, with the optimal discounts, via the optimal channel. Example: AI-powered price elasticity models can pinpoint the optimal price for each product, tailored to each offer type, customer segment, and sales channel. The result? Higher conversion rates and, for large organizations, revenue lifts worth tens or even hundreds of millions of dollars.
Increasing Product Value AI can also be used to uncover insights that enhance and personalize your offerings, delivering better user experiences, justifying premium pricing, and boosting customer retention.
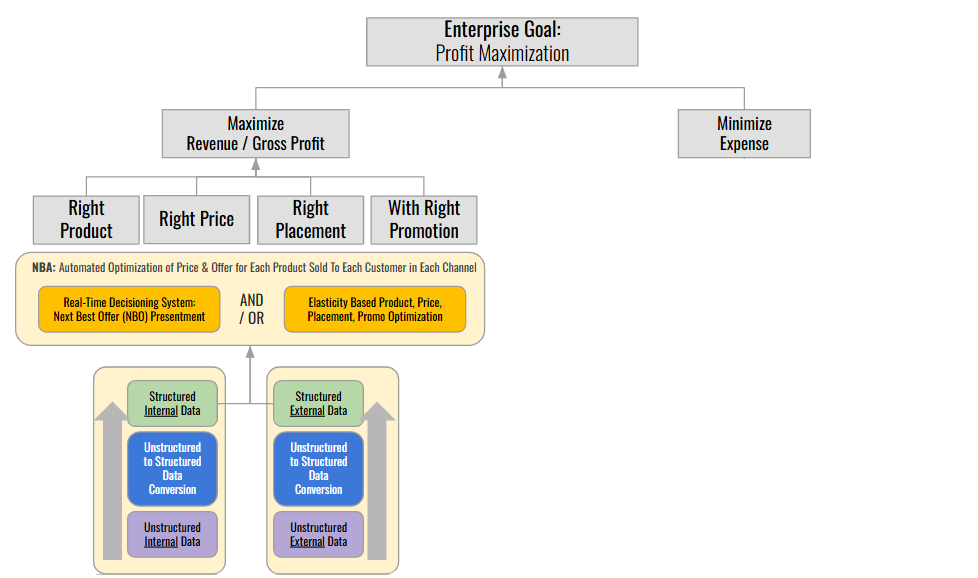
Generative AI: Generative and Agentic AI take this further by structuring unstructured data, like social media sentiment or competitor pricing, and feeding it into NBA frameworks. The result is a “keystone” decision engine that unifies a vast array of data sources, aligns numerous analytical efforts, and enables real-time optimization of customer engagement. Companies that master this often leap far ahead of less analytically mature competitors.
Timing vs. Potential The upside in the Revenue Maximization space is massive; and often unbounded. Whether refining the 4 P’s for current products or identifying what to build next, the potential lift in revenue and gross profit can be transformative.
Build time: Initial NBA frameworks can often launch in 2–3 months.
Full scale: Complex, enterprise-grade optimization frameworks typically take many months/years to perfect.
Value delivery: Expect initial results only after multiple rounds of in-market testing, which can take many months. The long-term payoff can be game-changing however, often tens or hundreds of millions of dollars for large companies.
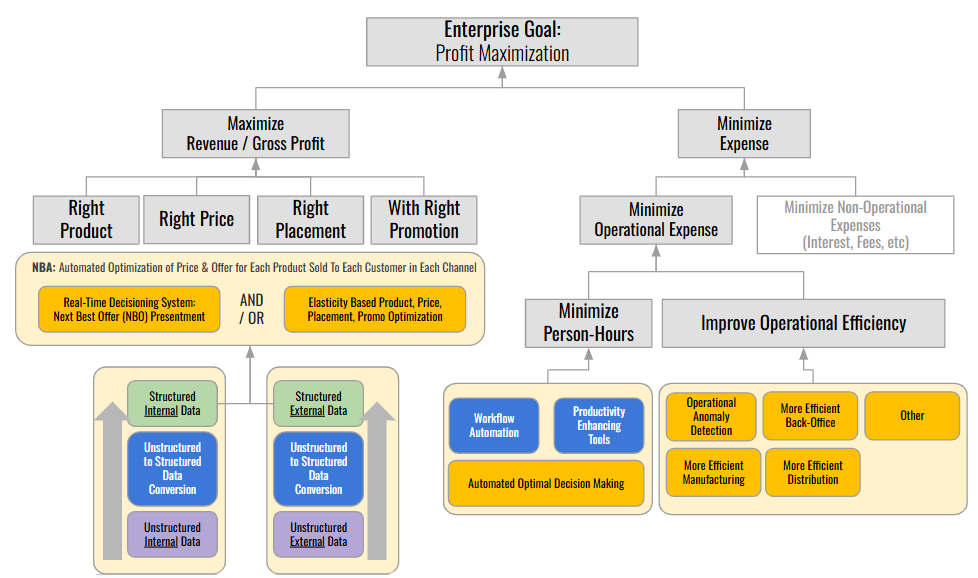
Minimizing Costs
AI doesn’t just drive revenue, it can slash costs too (with constraints).
While AI can deliver savings in many areas, the biggest wins in the Expense Minimization space often come from operational efficiencies that transform how a business runs.
1. Reducing Person Hours AI-powered automation tools, such as workflow optimizers or general-purpose solutions like secure implementations of Copilot or ChatGPT, can streamline repetitive tasks. Agentic AI can fully automate complex processes, like customer support or data entry, freeing employees for higher-value work.
2. Boosting Operational Efficiency AI can make operations leaner, faster, and more precise. Several areas of application include:
Anomaly Detection – Catches fraud, stockouts, or abnormal returns early to prevent losses.
Manufacturing Optimization – Uses IoT data to maximize throughput and minimize waste.
Distribution Efficiency – Improves routing, customs handling, and supply chain logistics.
Back-Office Automation – Streamlines invoicing, compliance, and other administrative tasks.
Generative AI: Generative AI tools, including large language models, Agentic AI constructs, and more can be used to deliver significant value in the expense minimization space. From implementations making workflows more intelligent, to Master Data Management (MDM) entity resolution builds, to implementations that enhance safety, generative AI has an important role to play in this space. However, despite the buzz that leaders may have heard in the popular media, GenAI tools are not the solution to every problem. It is important to remember where and when to deploy these tools to ensure consistency, reliability, compliance, and fit for purpose. Our “What is AI?” article mentioned above discusses this in detail.
Timing vs. Potential The cost-saving benefits of these applications often show up within weeks or months, making them some of the quickest wins in AI. But there’s a ceiling. You can’t save more than you spend, and essential capital and operational expenses will always remain.
That said, AI-driven efficiency gains can still be substantial, measurable, and fast to realize, making them an excellent early focus for organizations starting their AI journey. In summary:
Build Time: Often rapid, short to medium term solution build times
Full Scale: Scaling up solutions can often be done quickly.
Value Delivery: A finite opportunity space. Still, value delivery can be significant.
Step 4: Prioritizing AI Initiatives: A Structured Approach
With countless AI applications possible across both revenue maximizing and expense minimizing domains, prioritization is critical. A disciplined approach ensures resources are allocated to high-impact projects:
Quantify Business Value: Estimate the financial impact of each AI project. Ask: “How much is spent on this process today?” and “What would a 1% improvement yield?” For example, a 1% reduction in supply chain costs could save millions annually for large firms.
Create a Value Scatterplot: Plot projects by potential value (y-axis) and implementation timeline (x-axis) to identify quick wins (high value, short-term) and strategic bets (high value, long-term).
Sequence Initiatives: Determine dependencies between projects. For instance, building a data pipeline may be a prerequisite for predictive analytics. The Next Best Action framework often serves as a “keystone” analytical framework, integrating outputs from other analyses which themselves have to be constructed first.
Establish Model Governance: Implement robust oversight to ensure analytical outputs are reliable and that they don’t propagate errors across systems. This includes regular model validation and data quality checks. For more, see our article on Model Governance.
Step 5: Deploying AI: Best Practices
Successful AI deployment requires alignment with business goals, scalable infrastructure, and risk management:
Start Small, Scale Fast: Begin with pilot projects to test ROI, then expand to enterprise-wide solutions.
Leverage Existing Data: Use structured data where available and employ GenAI to process unstructured sources.
Ensure Scalability: Build AI systems on secure cloud-based platforms to handle large-scale data and compute needs.
Mitigate Risks: Address ethical concerns, bias, and regulatory compliance through transparent model design and regular audits.
Step 6: Measuring and Sustaining Value
To derive consistent, risk-adjusted value, track key performance indicators (KPIs) tied to profit maximization or cost reduction. For revenue-focused projects, monitor metrics like conversion rates or average order value. For cost-saving initiatives, track operational metrics like process cycle time or error rates. Regularly review these KPIs to refine AI models and ensure sustained impact.
Conclusion
AI’s potential is massive, but potential alone won’t pay the bills. The value comes from strategic alignment, disciplined execution, and relentless measurement.
When business leaders:
Understand AI’s true capabilities
Align every initiative with profit-driven objectives
Prioritize ruthlessly
Deploy with strong governance
…they stop treating AI as a buzzword and start using it as a profit engine.
Begin with a clear vision. Build in deliberate, focused steps. Measure everything. Adjust without hesitation. Do this, and AI won’t just support your strategy, it will amplify it.
Speaking with senior business leaders across a range of industries in recent months, we’ve observed both a strong interest in, and significant confusion about, the topic of Artificial Intelligence. In these conversations, one question in particular comes up time and again: “What is AI?”
From the latest breakthroughs in tools like ChatGPT to sweeping claims that Agentic AI will soon render many white-collar jobs obsolete, the media is awash with headlines that portray AI as either a miraculous breakthrough or a looming threat. The result is a dizzying narrative that leaves many business leaders unsure of what to believe, or how to respond.
The leaders we’ve spoken with are eager to ensure their organizations don’t fall behind. While many are driven by a clear sense of FOMO (Fear of Missing Out), they are equally intent on beginning or expanding their AI journey in a thoughtful and strategic way; investing in AI capability builds that stand the best chances of delivering significant ROI, all while carefully managing implementation risks.
Yet despite this desire to act, most admit they’re unsure where to begin, or even what “AI” really means in a business context. This article aims to address that gap by offering a clear and practical overview of AI: what it is, how it works, and where it adds value. Our goal is to help leaders move beyond the hype and move toward informed, high-impact decision-making.
The Hype:
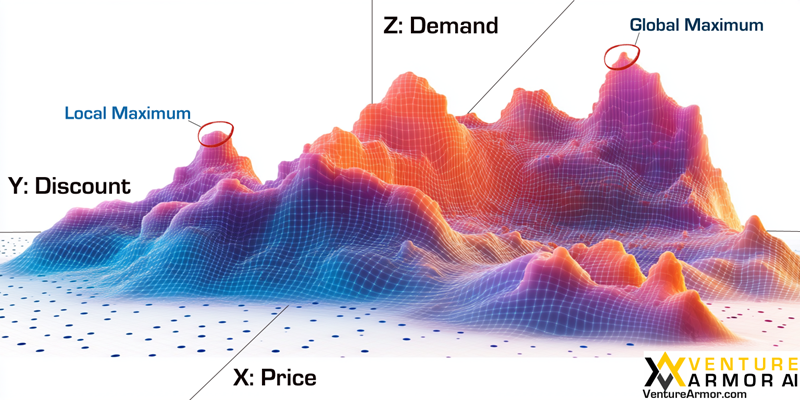
Many AI-related topics, such as Generative AI, Responsible AI, and Artificial General Intelligence, currently sit near the top of the “Peak of Inflated Expectations” in Gartner’s 2024 AI Hype Cycle graph (link). The enthusiasm surrounding AI is understandable: it represents one of the most powerful and transformative technologies of our time.
However, a troubling trend has emerged. A wave of self-styled “AI influencers”, many with little to no background in the field, and others looking to capitalize on the current AI-hype are aggressively promoting multi-million-dollar “GenAI transformations” that claim to be able to solve virtually every challenge a business could face. Companies that buy into this hype often find themselves disappointed: drained of cash and no closer to achieving meaningful business outcomes.
For example, Gartner recently estimated that 40% of “Agentic AI” initiatives will be scrapped by 2027 driven by high costs, lack of business value, and poor risk controls. “Most agentic AI projects right now are early stage experiments or proof of concepts that are mostly driven by hype and are often misapplied. […] This can blind organizations to the real cost and complexity of deploying AI agents at scale, stalling projects from moving into production. They need to cut through the hype to make careful, strategic decisions about where and how they apply this emerging technology.” (Article Link)
“Most agentic AI projects right now are early stage experiments or proof of concepts that are mostly driven by hype and are often misapplied. […] This can blind organizations to the real cost and complexity of deploying AI agents at scale, stalling projects from moving into production. They need to cut through the hype to make careful, strategic decisions about where and how they apply this emerging technology.”
The reality is that a broad ecosystem of AI and machine learning technologies have been around since the 1950s. Far from hype, most are proven, battle-tested tools that underpin trillions of dollars in global economic activity each year. From financial services and supply chain management to retail and wholesale operations, traditional AI solutions quietly and reliably drive value at scale every day.
The key to realizing value from AI lies not in grand promises, but in knowing which tools to deploy, where, and when… including the latest modern advances like large pretrained neural network models and tried and true classical AI/ML tools. This article offers a grounded survey of the current AI landscape to help guide that decision-making.
The key to realizing value from AI lies not in grand promises, but in knowing which tools to deploy, where, and when… including modern advances like large pretrained neural network models and tried and true classical AI/ML tools. This article offers a grounded survey of the current AI landscape to help guide that decision-making.
What Is AI? A Brief Definition
As we begin to explore the breadth, depth, and taxonomy of the overall AI space, perhaps a good place to start is with a high-level definition of “AI”.
AI is technology that enables computers and machines to simulate human learning, comprehension, problem solving, decision making, creativity and autonomy.
While no standard definition for AI exists, this is a relatively clean one, and a solid start to our journey into the AI space. Fundamentally, AI is a domain of tools capable of delivering unique insights and outputs beyond what other tools and techniques are capable of delivering. These tools can mimic and often far exceed the insight generating, problem solving, and other abilities of humans.
With this broad definition now in-place, let’s next dive into a slightly different definition of AI. This definition attempts to define AI in terms of the types of end-insights that AI can deliver, and the incremental levels of value that these insights are able to provide to businesses.
What is AI? Types of Insights and Value Delivery
(click to enlarge)
In this view of AI, we show how AI leverages data to deliver unique insights beyond what other tools and techniques can deliver. AI tools enable businesses to undertake the “Advanced Analytics” portion of the Analytics Maturity Curve shown above (full article here). While this article provides a comprehensive overview of each node on this curve, below is a brief summary of the nodes in the Advanced Analytics section on the right half of this curve.
Diagnostic Analytics:Explaining How Things that Happened Are Related. Diagnostic analytics uncovers the root connections and relationships between variables associated with events, past or present.
Predictive Analytics: Forecasting What Will Happen. AI tools are used to forecast future outcomes based on historical patterns and relationships in data.
Prescriptive Analytics: Determining How To Optimize What HappensNext. This stage focuses on providing actionable recommendations and optimizing decision-making.
Bottom-line, AI enabled Advanced Analytics delivers business insights and value far beyond what raw data, cleaned data, and/or Business Intelligence (BI) dashboards can deliver. While potentially powerful, again, it is important that the right AI tool is used to tackle each business problem in the context of each node on this curve.
Tool Selection :
As business leaders attempt to navigate AI-hype, an analogy speaking to the importance of tool selection can be found in the field of plumbing. If you have a leaky pipe, and you hire a plumber to fix it, if that plumber (i.e. a technical professional) shows up and their first tool choice is to use their recently acquired, extremely complex, and sometimes unreliable pipe repair machine (i.e. the latest GenAI tool), you may begin to have well-founded second thoughts on their services. Could this complex tool be used to fix the problem? Maybe. Would a different and more direct tool be a better choice? Likely so.
If you have a leaky pipe, and you hire a plumber to fix it, if that plumber (i.e. a technical professional) shows up and their first tool choice is to use their recently acquired, extremely complex, and sometimes unreliable pipe repair machine (i.e. the latest GenAI tool), you may begin to have well-founded second thoughts on their services.
Choosing the simplest and most direct AI solution when tackling a business problem is often the best path forward. Still, there are absolutely business problems that GenAI and Agentic AI tools are perfectly adapted to tackle… they are just not the right tool for every problem.
With that in mind, let’s next dive into an overview of the taxonomy of the AI tool space. We’ll cover how these tools are organized, and what kinds of problems each is generally used to solve.
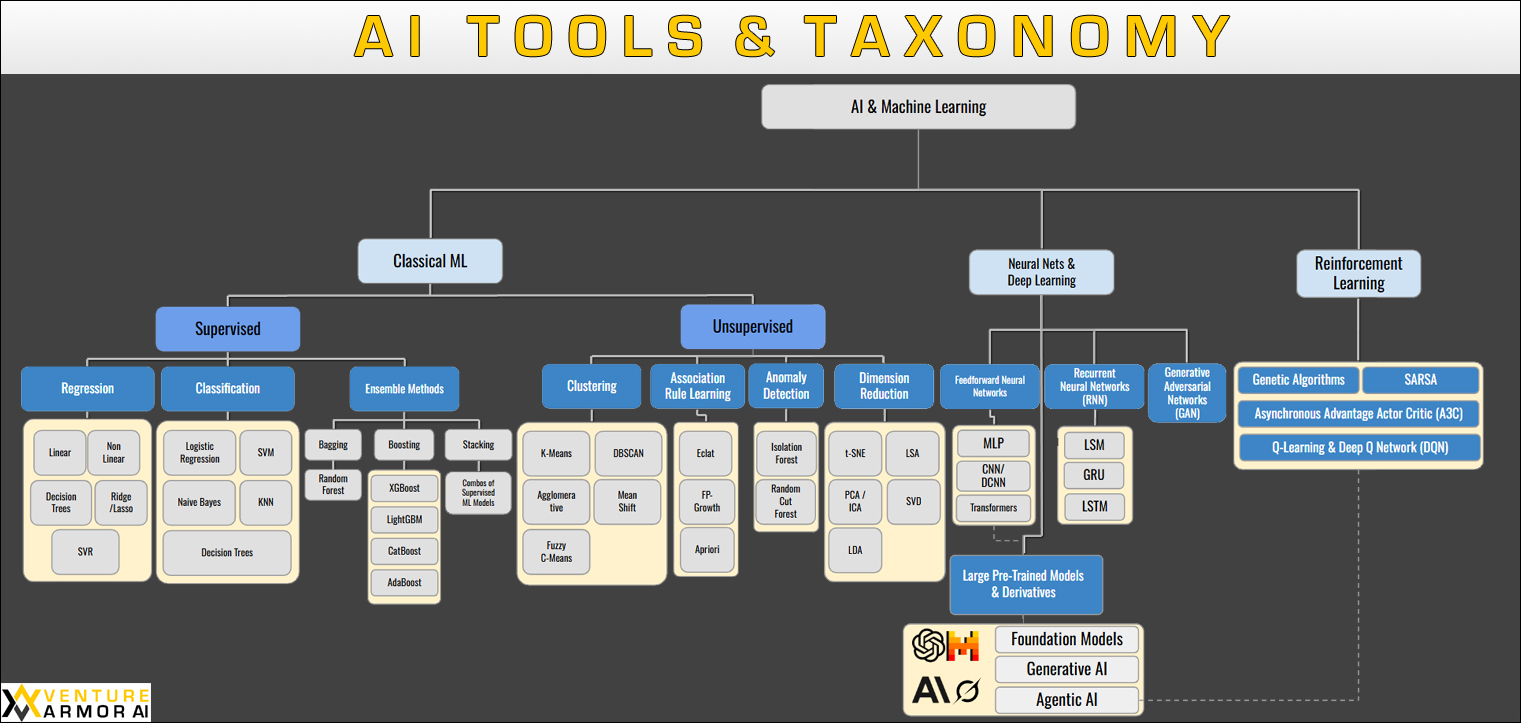
What is AI? AI Tools, Taxonomy, & Uses
(Click to enlarge)
The above diagram provides a high level overview of the taxonomy of the tools in the AI space. Please note that this is not a comprehensive diagram, as hundreds of tools exist in this space. Regardless, most AI tools can be generally categorized into this general structure.
Machine Learning: The Foundation
At the root of our taxonomy sits Machine Learning; the core discipline that enables computers to learn patterns from data without being explicitly programmed for every scenario. Rather than writing specific rules for every possible situation, machine learning algorithms identify patterns in historical data and use these patterns to make predictions or decisions about new, unseen data.
Classical Machine Learning (ML): The Proven Workhorses
(Click to Enlarge)
Classical Machine Learning represents the suite of mature, battle-tested approaches that have driven countless trillions in business value since the first tools in this space were deployed in the 1950’s. These techniques form the backbone of everything from credit scoring systems to marketing optimization systems, and beyond. Modern global business is built on the backbone of classical machine learning assets, with billions of dollars of business decisions being made by Classical ML systems daily.
Supervised Learning
Supervised Learning algorithms learn from labeled training data, essentially learning from examples where we already know the correct answer. This category splits into three primary approaches:
Regression tackles problems where we’re predicting continuous numerical values. Linear regression, for instance, might predict house prices based on square footage, location, and amenities. Financial institutions use polynomial regression models to forecast loan default amounts, while retailers employ these techniques for demand forecasting and inventory optimization.
Classification handles problems where we’re categorizing data into discrete groups. Email spam detection is a classic example, algorithms learn to classify emails as “spam” or “legitimate” based on content patterns. Banks use logistic regression for binary decisions like loan approvals, while support vector machines (SVMs) excel at complex classification tasks like fraud detection, where subtle patterns in transaction data can indicate suspicious activity.
Ensemble Methods combine multiple algorithms to achieve better performance than any individual approach. Random forests and gradient boosting machines are workhorses in data science competitions and production systems alike, used for everything from credit risk assessment to predictive maintenance in manufacturing. Bagging trains multiple models independently on different random subsets of the data and then averages their predictions. Boosting trains models sequentially, with each model learning from the errors of its predecessors. Stacking is where the predictions from two or more models are used as the input for another model, which delivers the final predictions.
Unsupervised Learning
Unsupervised Learning discovers hidden patterns in data without predefined labels, essentially finding structure in unstructured information.
Clustering groups similar data points together. Retail companies use K-means clustering for example, to segment customers based on purchasing behavior, enabling targeted marketing campaigns. Healthcare organizations employ clustering to identify patient populations with similar treatment responses, while telecommunications companies use it to detect network anomalies.
Association Rule Learning identifies relationships between different variables. The classic example is market basket analysis: “customers who buy bread and milk also tend to buy eggs.” E-commerce platforms use these algorithms for product recommendations, while streaming services apply them to suggest content based on viewing patterns.
Anomaly Detection refers to the identification of rare or unusual data points that deviate significantly from the majority of the data. Algorithms like Isolation Forest and Random Cut Forest detect anomalies by modeling how easily a data point can be separated or isolated from the rest of the dataset. These techniques are well-suited for high-dimensional, unlabeled data and are widely used in fraud detection, system monitoring, and predictive maintenance.
Dimension Reduction simplifies complex datasets while preserving essential information. Principal Component Analysis (PCA) is commonly used in finance to reduce the complexity of portfolio risk models, while techniques like t-SNE help visualize high-dimensional data in fields ranging from genomics to social media analysis.
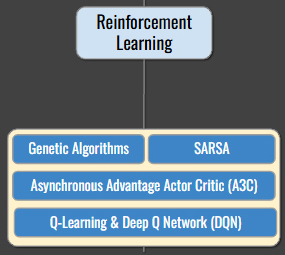
Reinforcement Learning: Learning Through Trial and Error
Reinforcement Learning takes a different approach entirely. Algorithms learn optimal behavior through trial and error, receiving rewards or penalties based on their actions. This mirrors how humans and animals learn through experience.
Gaming provides some of the most visible examples of reinforcement learning in action, from AlphaGo’s mastery of the ancient game of Go to more recent successes in complex video games. However, the real-world business applications are equally impressive: algorithmic trading systems that adapt to changing market conditions, autonomous vehicle navigation systems that learn to handle diverse driving scenarios, and resource allocation systems that optimize everything from data center cooling to supply chain logistics.
The beauty of reinforcement learning lies in its ability to discover strategies that human experts might never consider, often finding counter-intuitive solutions that prove remarkably effective.
While SARSA, A3C, Q-Learning, and DQN have extensive applications in robotics, game playing, and autonomous vehicle navigation, the reinforcement learning tool used most often for general business data science purposes is Genetic Algorithms. Genetic Algorithms are optimization techniques inspired by natural selection, where a population of potential solutions evolves over generations. They are used to solve complex problems, such as optimizing supply chain logistics or designing efficient engineering systems, by iteratively improving solutions through selection, crossover, and mutation.
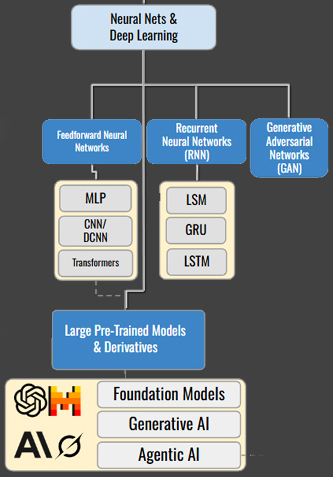
Neural Networks and Deep Learning: The Modern Revolution
Neural Networks and Deep Learning represent the current frontier of AI research and tool development, enabling machines to tackle problems that were previously impossible to solve computationally.
Feedforward Neural Networks Feedforward Neural Networks are the foundational architecture in deep learning, where data flows in one direction, from input to output, without loops. This category includes: MLP (Multilayer Perceptron): Fully connected layers used for basic classification and regression tasks. CNN/DCNN (Convolutional Neural Networks): Specialized for processing grid-like data such as images, using convolutional layers to detect spatial hierarchies and patterns. Transformers: Advanced attention-based models designed to process sequential data in parallel, enabling state-of-the-art performance in language, vision, and multimodal tasks. Transformers are the basis for all modern large models (BERT, GPT, etc.).
Recurrent Neural Networks (RNNs), including specialized variants like LSTMs (Long Short-Term Memory networks), handle sequential data brilliantly. Financial institutions use them for time-series forecasting, predicting everything from stock prices to currency fluctuations. Natural language processing applications, from sentiment analysis to language translation, rely heavily on these architectures.
Generative Adversarial Networks (GANs) represent a fascinating approach where two neural networks compete against each other; one generating fake data, the other trying to detect fakes. Beyond their famous applications in creating realistic images, GANs are used for data augmentation in medical research and generating synthetic datasets for testing systems without compromising privacy.
Large Pre-Trained Models and Derivatives: The Modern Frontier
This taxonomy also includes the cutting-edge developments that are capturing headlines: Large Pre-Trained Models and their derivatives, including Large Pre-Trained Foundation Models, Generative AI, and Agentic AI. These represent the newest branches of the AI family tree, built upon the neural network foundation but capable of remarkable new capabilities.
Large Pre-Trained Foundation Models: Large Pre-Trained Foundation Models are massive neural networks trained on vast, diverse datasets, often containing billions of parameters. These models, such as BERT (Google), GPT-4 (OpenAI), and LLaMA (Facebook), are designed to capture general knowledge and patterns from text, images, or multimodal data. They are pre-trained in an unsupervised or self-supervised manner and can be fine-tuned for specific tasks, making them highly versatile.
Generative AI: Generative AI refers to systems that create new content, such as text, images, audio, or video, by learning patterns from existing data. While often built on Large Pre-Trained Foundation Models, Generative AI focuses specifically on content creation. Techniques include Generative Adversarial Networks (GANs (mentioned above)), Variational Autoencoders (VAEs), and transformer-based models like ChatGPT or Stable Diffusion.
Agentic AI: Agentic AI refers to systems that autonomously perform tasks, make decisions, and interact with environments or users to achieve specific goals. Unlike traditional AI, which reacts to inputs, Agentic AI systems are proactive, leveraging reasoning, planning, and sometimes external tools (e.g., APIs, databases) to execute complex workflows. These systems often incorporate foundation models but emphasize autonomy and goal-directed behavior. More on Agentic AI below.
Quick Reference Summary
Again, choosing the right AI tool to tackle the business challenge you are trying to solve is important. The table below provides a quick-reference summary of the right AI tools for several applications.
Application
Tool
Example
Forecasting: Continuous Values
(Classic ML > Supervised > Regression)
Sales Prediction Analytics
Forecasting: Binary Values
(Classic ML > Supervised > Classification)
Marketing Acquisition Analytics
Optimization
Reinforcement Learning > Genetic Algorithms
Price & Offer Optimization Analytics
Natural Language Processing
Neural Nets > Large Pre-Trained Models
Analyzing Customer Reviews for Sentiment
Dividing Populations Into Natural Sub-Groups
Classical ML > Unsupervised > Clustering
Customer Segmentation
Unstructured Data Analysis
Neural Nets > Large Pre-Trained
Extracting Key Data Elements from PDFs
Please see the following related posts for more information on how AI can be used to solve specific business problems, and the all-important topic of AI governance:
Automated Analytics and “Agentic AI”: Why the buzz?
So far, we have described 1) the types of business insights that AI can deliver, and 2) the taxonomy of the tools in the AI space. While choosing the right AI tool to tackle each business challenge is important, we have not yet discussed whoor what uses these tools? This brings us to the topic of automated analytics and the very hot buzz term: “Agentic AI”.
Manual vs. Automated Analytics:
Traditionally, building, tuning and deploying AI tools was a time consuming process that required expert data scientists to work for weeks on-end to complete. In recent years however, a number of capabilities have been developed that have dramatically sped up the model development process.
AutoML:
When building a model, especially classical machine learning (ML) models, after data scientists have spent time aggregating data, traditionally they would then manually go through the process of sequentially applying a series of different AI models to the data, to see which one provided the best “fit” or predictive “lift” in relation to their target variable. When applying each model, analysts would traditionally have to manually “tune” the parameters (similar to adjusting the controls) for each model in an attempt to maximize the predictive power of each model application. This was a time consuming process, since the number of combinations of parameter/control settings that analysts would have to explore could be quite large for any given model. Tuning these values across all of the models they could use was a process that could take many weeks or months.
For many years now however, various data science platforms (e.g. H2O.ai, Databricks, and others) have deployed solutions categorically labelled as “AutoML” to address this challenge. These solutions automatically and sequentially apply dozens of AI models to a user’s data, automatically and optimally tuning each model’s parameters as it proceeds. These automated model tuning frameworks use either brute force or (the better ones) use genetic algorithms to explore the often highly multidimensional opportunity space, to find the optimal solution. The results from each model tuning run are automatically cataloged, and the system generates a simple report at the end letting the analyst know what model and tuned parameters provide the best fit/lift. These tools have transformed the model development process from something that formerly could take a few weeks/months, to an exercise that often takes less than an hour to complete; all while also generating superior results than could be obtained by attempting to explore the opportunity space by manual means.
Real-Time Decisioning Systems:
While recent developments in the AutoML space have made manual AI model builds faster, easier, and more accurate, an entirely different class of analytical solutions have removed humans from the model construction and deployment loop entirely. Real time decisioning platforms like Pega’s Customer Decision Hub (CDH) are used by companies to not only manage the presentment of text, images, and offers within website and mobile app page real estate, they also automatically optimize the displaying of this content using AI. Pega in particular leverages a Naïve Bayes based content optimization modeling framework to accomplish this task; see above taxonomy (Classical ML) > (Supervised) > (Classification) > (Naïve Bayes). These models, which they call “Adaptive Learning” models, intake data on who is using the website/mobile-app, and automatically optimize the displaying of content.
Depending on the volume of incoming users, and configuration settings within the system, Pega CDH can refit and relaunch various system embedded Adaptive Learning AI models 10 or more times per day… a pace far outstripping what any human could ever do via manual means. While impressive, solutions like Pega CDH are not designed to solve every AI use case. When applied appropriately however, they are absolutely able to automatically deliver massive ongoing value at scale.
Agentic AI:
The “Large Pre-Trained Model and Derivatives” space in our above taxonomy is developing quickly. Many of the AI in this space are now capable of moderate to even advanced reasoning abilities. Models in this space include OpenAI’s ChatGPT, Anthropic’s Claude, X’s Grok, and many others. Many of these models are now connected to a live feed of the internet, and also have access to a variety of coding, data science, and other development tools. While each of these models may have limited innate built-in capabilities, by providing them with real-time access to the web and a variety of other AI and non-AI tools, they are now able to deliver insights far beyond what is available from the training data these models themselves were built on.
This situation is analogous to owning a humanoid robot that itself is incapable of cutting grass because it lacks a built-in grass trimming blade. However, if this robot were able to access a lawn mower, and could competently use it, not only could it mow lawns, but it could potentially mow lawns perfectly 24/7. With Agentic AI (i.e. relating to autonomous AI “Agents”), this is a possibility, and the implications are massive.
As of the time of the writing of this article in late June of 2025 however, while these systems hold tremendous promise, numerous as-of-yet unsolved technical and governance challenges still exist around them that prevent their broad-based production-quality roll out beyond certain limited applications. One of the greatest of these challenges is how to effectively govern their autonomous agentic work, especially when the foundation models upon which they rely are prone to, and are well known to, “hallucinate”; delivering inconsistent behavior.
While we are confident that these challenges will be overcome in time, the Agentic AI systems we have seen to date are not yet able to perform reliably enough to make them suitable for most mission-critical business decisioning/execution applications. Having said that, despite their current inadequacies, they may still be perfectly suited in their present, albeit imperfect forms, for other non-mission-critical supporting applications. We expect these limitations to erode quickly however, and do believe that Agentic AI systems represent the foundation upon which massive reliable future business value will be delivered. Perhaps in another 8 – 12 months these frameworks will be ready for mission critical applications.
Conclusion
In this article, we discussed the dynamic landscape of Artificial Intelligence (AI), addressing the excitement and confusion among business leaders navigating its potential. We clarified AI’s definition, capabilities, and value through a taxonomy of tools, from classical machine learning to cutting-edge Generative and Agentic AI; highlighting their potential applications in delivering diagnostic, predictive, and prescriptive insights.
By distinguishing between the hype of costly and often ill defined “GenAI transformations” and the proven, battle-tested AI solutions that have driven countless billions in value across industries, this article intends to equip business leaders with the insights needed to make informed AI-related investment decisions.
About VentureArmorAI
At VentureArmor AI, we specialize in helping businesses unlock the power of AI to maximize business value delivery; expertly deploying the right AI tool(s) to solve business problems. Our expertise in AI analytics and data-driven solutions enables us to deliver tailored solutions that meet the unique needs of our clients. Contact us to learn more about how we can help your organization achieve its goals through the strategic application of AI. VentureArmor: Delivering ROI with AI.
In the world of advanced analytics led digital transformation, many organizations start their journey by optimizing the most tangible and immediate levers; typically price, promotion, or product recommendation. This is often framed as “Next Best Offer” (NBO), and for good reason: it’s measurable, impactful, and relatively easy to isolate. In retail, for instance, price elasticity modeling allows businesses to optimize pricing and quantify expected demand, boosting both bottom-line profitability and operational efficiency.
But what happens when we zoom out?
Most businesses already have access to vast amounts of data. Many have reporting platforms and dashboards. Some even have mature analytics functions developing predictive and prescriptive models. And yet, despite all of these capabilities, few are truly optimizing enterprise decisions in a unified, system-level way. Instead, optimization tends to happen in silos; by department, channel, or use case, without a central, unifying objective.
This is where Next Best Action (NBA) comes into play.
A North Star for Enterprise Analytics
NBA is more than a customer engagement tactic. It’s a strategic framework for decision optimization at every level of the enterprise. Where NBO answers “What’s the best thing to offer this customer right now?”, NBA expands the question: What’s the best decision we can make next; given all we know, all we can control, and all we’re trying to achieve?
From this perspective, the business becomes an optimization problem, and every analytical asset, from a churn model to a forecast engine, becomes a modular component feeding into a broader system.
But the question remains: how do we operationalize this approach?
A Simple, Powerful Anchor: The Financial Statement
One practical suggestion is to use the company’s Profit & Loss (P&L) statement or cash flow statement as the foundational framework for enterprise-wide optimization; using it as the basis for the construction of a digital twin of the enterprise.
Financial statements already reflect how all aspects of the business tie together, from revenue, to costs, margins, capital expenditures, and ultimately, profit. Importantly, they codify the structure and constraints of the business. They serve as the organization’s most universal language and objective function.
Here’s how it works:
Define the Optimization Goal: Most often, it’s net profit, operating margin, or ROI. Whatever the case, the objective must be measurable and owned at the executive level.
Map Analytics to Financial Line Items: For example: Price elasticity models impact revenue, Churn models impact recurring revenue, Inventory optimization affects COGS, Staffing models influence SG&A, Risk models affect provisions and loss reserves.
Model Cause-and-Effect Relationships: This is where simulation and sensitivity analysis come in. If we lower prices by 5%, how much volume do we gain? What’s the impact on margin? Does it affect logistics costs or staffing needs? By modeling these relationships, we make the system navigable.
Codify Constraints and Boundaries: These might include budget ceilings, fulfillment capacity, minimum staffing levels, or even legal/compliance boundaries. Constraints define what is and isn’t feasible, and help the optimizer stay grounded in reality.
Run Optimization Scenarios: Just as financial planning and analysis (FP&A) teams create best-case, base-case, and worst-case forecasts, a Next Best Action engine could recommend a series of actions under each scenario to guide both strategic and operational choices.
The Critical Role of FP&A in Digital Twin and Decision Optimization Frameworks
As organizations evolve toward more advanced decision optimization frameworks, particularly those anchored by concepts like Next Best Action (NBA) and powered by a digital twin of the enterprise, the role of the Financial Planning and Analysis (FP&A) team becomes increasingly central. FP&A is often viewed as a back-office function, but in reality, it holds the keys to understanding how decisions translate into financial impact. No digital twin of an enterprise is complete without embedding the economic logic codified by FP&A: cost structures, revenue models, investment horizons, and financial constraints.
Where data scientists and analytics teams model customer behavior, price elasticity, or operational risk, FP&A brings the critical lens of profitability, cash flow, and strategic allocation of resources. Their domain knowledge is essential in shaping the mathematical models that simulate the business; ensuring that every optimized decision proposed by the system has traceability to a P&L outcome.
Moreover, the FP&A team’s stewardship of financial scenarios and forecasting makes them uniquely equipped to define the boundaries of business constraints. Whether it’s setting thresholds on promotional budgets, managing working capital exposure, or quantifying the trade-offs between short-term margin pressure and long-term growth, their insights help maintain fiscal discipline within an optimization effort.
To succeed, organizations must not treat FP&A as a recipient of analytical outputs but rather as a co-architect of the decision optimization system. When FP&A collaborates closely with analytics, operations, and data science teams, it ensures that decisions are not just analytically sound, but financially grounded, strategically aligned, and operationally feasible. In short: the future of data-driven decision-making is not just powered by models, it’s funded, framed, and focused by FP&A.
A Complex System, Not a Simple Machine
It’s important to acknowledge: businesses are complex systems, not linear machines. Decisions made in one part of the business ripple into others, often in unpredictable ways. A price change can shift demand, which can alter inventory needs, which affects staffing, which impacts customer experience, which loops back to demand.
This is where systems thinking and complex system theory come in. NBA isn’t just about “what’s optimal in a vacuum”, it’s about navigating a dynamic system full of feedback loops, lag effects, and emergent behaviors. The more these interconnections are modeled, the more realistic and resilient the recommendations become.
Why This Matters Now
In today’s environment, businesses are being asked to do more with less. Margins are under pressure. Customer expectations are rising. And leaders are looking for clarity amid complexity.
The temptation is to chase the latest shiny object, like generative AI, without anchoring it to business value. But by grounding analytics in the enterprise’s financial reality and decision-making needs, we ensure that each model, each insight, and each algorithm is part of a larger value chain.
NBA, framed by financial statements and powered by analytics, offers not just better answers, but better questions. It helps businesses see themselves more clearly, act more intentionally, and align everyone, from data scientists to CFOs, toward the same outcome.
About VentureArmor
At VentureArmor, we specialize in helping businesses unlock the power of AI,Next Best Action (NBA), and Enterprise Digital Twins to drive operational excellence and profitability. Our expertise in AI analytics, pricing, and data-driven solutions enables us to deliver tailored solutions that meet the unique needs of our clients. Contact us to learn more about how we can help your organization achieve its goals through the strategic application of AI. VentureArmor: Delivering ROI with AI.
In most large enterprises, advanced analytics is no longer a novelty. In these organizations, large investments have often been made in data infrastructure, data science teams, and machine learning capabilities. Despite these investments, however, most analytics programs remain highly fragmented, tactical, and disconnected from the broader business mission. They lack a North Star; a unifying strategic focus that ties all analytical efforts together towards an end goal.
A few of the organizations at the forefront of AI development and deployment have started to address this challenge by adopting a unifying analytical objective. Through the concept of Next Best Action (NBA), they establish a central North Star that brings focus and cohesion to their various analytical efforts.
“Next Best Action is not just another analytics project – it’s the North Star that turns fragmented insights into coordinated decisions, aligning every model and analytical endeavor toward integrated, purposeful, and outcome-optimizing action.”
-Matthew McKee, VentureArmor AI Founder
The Case for a Unifying Analytics Focus
If we think about enterprise analytics as an optimization problem supporting an organization’s overall mission – and I believe we should – then the absence of a clear objective function often leads to wasted and fragmented effort. In any optimization setup, four elements are crucial:
A Clear Goal: What is the business ultimately trying to achieve? Maximize Customer Lifetime Value, Sales, Profitability, Loyalty, or another enterprise objective?
Decision Variables: What levers does the business control that can influence outcomes? (e.g., Product selection, Pricing, Placement, Promotion).
Constraints: What limitations must be respected? Budgetary limits, Discount Ceilings, Cost Structures, Execution Capacity Constraints, Inventory Levels, Regulatory Compliance Rules, and more must be considered.
Business Operating Model and Dynamics: What is the larger framework linking internal processes? For example, the relationship between Price Changes and Sales Volume (captured through Price Elasticity Modeling), or between Marketing Spend and Acquisition Rates.
The analytical optimization problem to solve in this context involves determining how to best accomplish an organization’s goals, using the optimal configuration of decision variables, within the confines of operational constraints, while exploring the possible paths forward in the context of a massively multi-dimensional mathematical representation of a business’ operating model.
Again, without a clear definition of these elements, advanced analytics devolves into disconnected projects: a churn model here, a sales forecast there, a customer segmentation exercise in another department; each valuable individually, but collectively directionless. Next Best Action offers a way to frame and link all of these analytics efforts cohesively.
What is Next Best Action?
At its core, Next Best Action is about deciding on the optimal move for a customer (or prospect, or internal stakeholder) at any given point in time, within any given channel, based on a customer’s context, preferences, and predicted future behavior. It is a customer-centric, dynamic, and model based decision optimization framework for an enterprise rather than an individual campaign-driven or channel-driven point analysis.
Next Best Action (NBA) answers the question, “Given everything we know, what should we do next to best serve this person and achieve our business objectives?“
In this sense, NBA transforms often fragmented and disjointed enterprise analytical efforts from a series of passive individual “tree-focused” exercises into a cohesive enterprise bottom-line objective optimization engine; encompassing a view of the entire “forest” of opportunity and operational complexity within a business.
When implemented properly, NBA both integrates and accelerates optimal decision making across all of these considerations, enabling optimized decision making within a continuous decisioning system.
Enterprise Analytics as an Optimization Problem
To optimally operate effectively under this framework, enterprises often must develop robust models for:
Customer Segmentation: Understanding who customers are and how they behave differently.
Attrition and Retention Modeling: Predicting customer churn and crafting strategies to prevent it.
Risk Modeling: Ensuring that actions comply with risk appetites and regulatory frameworks.
Demand Elasticity Models: Understanding how changes to decision variables impact outcomes.
Cross-sell / Upsell Models: Identifying where growth opportunities lie within the existing customer base.
Resource Optimization Models: Making sure capacity constraints are respected (e.g., service centers, logistics).
Each of these analytical efforts feeds into a larger NBA ecosystem, providing inputs or constraints. Importantly, none of these models is an end in itself. While they are each uniquely valuable, their value is amplified when they are combined to inform better next best actions. The combined whole of these models is far greater than the sum of their individual parts.
How Does Generative AI fit into this picture?
Generative AI has captured the spotlight, dominating headlines and reaching the very top of Gartner’s 2023 Hype Cycle Curve for Artificial Intelligence, at the “peak of inflated expectations”. While the excitement is undeniable, so too is the transformative potential, especially in unlocking value from unstructured data sources like text, images, and video.
However, amid the enthusiasm, discipline remains critical. In the context of a Next Best Action driven analytics strategy, Generative AI should not be pursued for its novelty alone. Ideally, every GenAI initiative should have a clear and mathematically definable connection to NBA, and it should be obvious how it will help an organization achieve its NBA-related objectives.
Before development begins, we advocate for a simple but rigorous standard: Can the outputs of the GenAI application be directly tied to improving the enterprise’s ability to make more informed, faster, or more effective decisions? If not, it risks becoming another siloed innovation; impressive in isolation, but disconnected from holistic enterprise value delivery.
Unfortunately, examples of misalignment are already widespread. Consider the explosion of website-embedded GenAI based customer chatbots. While vendors offering these chatbots often claim they generically “improve the customer experience”, or “save money on engagement costs”, many of these tools fail to deliver measurable improvements in either decision-making or business outcomes. In many cases, these chatbots can actually derail otherwise optimizable Next Best Action related offer/engagement presentment opportunities, and ultimately deliver negative incremental value when compared to other engagement options.
In short: Generative AI can be a powerful engine within a Next Best Action framework, but often only when tightly aligned to the mission of purposeful and holistic goal-driven decision optimization within an organization.
Practical Considerations
Of course, moving to an NBA-centered analytics strategy is not simply a technical exercise. It often demands:
Organizational Alignment: Business units, marketing, customer service, and analytics must collaborate around shared goals.
Real-time (or Near Real-time) Data and Decisioning: NBA frameworks often require updating recommendations dynamically as new information arrives.
Governance Structures: Clear rules must exist to arbitrate between competing actions (e.g., should we prioritize loyalty incentives over upsell offers?).
Measurement and Learning: Every action should feed back into the system to refine future decisions.
NBA is therefore not just a technical framework; it is an operating philosophy.
Conclusion
Enterprise advanced analytics endeavors should not exist in fragments. It should not be a collection of isolated models and projects with no common thread. Analytics should be thought of, and built, as an integrated optimization system, with clear goals, controllable variables, and well-defined constraints.
Next Best Action provides the North Star needed to unify these efforts. By anchoring all analytical developments to a decisioning framework focused on “what should we do next for this customer,” enterprises can ensure that every model, every dataset, and every algorithm has a meaningful role to play.
“The future of enterprise analytics is not more dashboards or stand-alone models. The future is more intelligent and coordinated action, and Next Best Action is the best way to get there”
-Matthew McKee, VentureArmor AI Founder
About VentureArmor
At VentureArmor, we specialize in helping businesses unlock the power of AI and Next Best Action (NBA) to drive operational excellence and customer satisfaction. Our expertise in AI analytics, pricing, and data-driven solutions enables us to deliver tailored solutions that meet the unique needs of our clients. Contact us to learn more about how we can help your organization achieve its goals through the strategic application of AI. VentureArmor: Delivering ROI with AI.
In an era where artificial intelligence (AI) and machine learning (ML) are transforming industries, ensuring robust governance of these models is crucial. Model governance has long been a well-established practice in the financial services industry, where model risk management is guided by three core risk concepts: Exposure, Reliance, and Uncertainty. These principles provide a strong foundation for governing both classical ML models and the more recent advancements in Generative AI (GenAI).
By applying these well-defined risk concepts, organizations can develop structured governance frameworks that mitigate risks and ensure AI-driven decision-making remains ethical, reliable, and transparent. In this article, we will explore these three categories of model risk and discuss best practices for mitigating them in both classical ML and Generative AI models.
Understanding Model Risk: Exposure, Reliance, and Uncertainty
Financial institutions have long considered model risk within three broad categories: Exposure, Reliance, and Uncertainty. While these concepts have been applied to statistical and ML models for decades, they can and frequently are applied to assess and govern Generative AI models.
Exposure Risk: The Cost of Getting It Wrong
Exposure risk refers to the financial and reputational risks an organization assumes when implementing a model. This risk is particularly high when a model is directly tied to critical financial decisions, such as loan underwriting, fraud detection, or trading strategies.
For example, a machine learning model designed to assess loan risk carries significant exposure risk. If the model is flawed—due to issues in data quality, bias, or inadequate validation—the financial consequences could be severe for the company that implements this model. In particular, improperly underwriting loans may not only lead to substantial direct financial losses from making bad loans based on the model’s bad recommendations, additional and often very substantial regulatory fines can also be levied against the organization if the model facilitates adverse impact or illegal recommendations (e.g. discriminatory lending practices). Aside from these very real and immediate financial consequences, poor quality models can drive decisions that also damage a company’s brand and reputation within the market, further eroding profitability and revenue generating potential in the future.
When assessing exposure risk, organizations should:
Conduct rigorous testing and validation: Models should be rigorously stress-tested to identify weaknesses before deployment. The rigor of this testing should be comparable to the risk that the roll-out of a model presents to the organization.
Implement fairness and bias assessments: AI models, particularly in highly regulated industries, must be scrutinized for bias and ethical concerns.
Ensure regulatory compliance: Compliance with frameworks such as SR 11-7 (for model risk management in banking) helps mitigate regulatory exposure. The US Federal Reserve’s Model Risk Management Guidance (PDF) provides an excellent overview of the topic.
These same principles apply to Generative AI. For instance, if a financial institution deploys a GenAI chatbot to provide customer investment advice, any misleading or incorrect outputs could result in regulatory penalties, lawsuits, and customer distrust.
Regardless of the model type; classical statistical model, machine learning model, deep learning model, generative AI model, the means and measures of assessing exposure risk are the same. Regardless, if a particular model application is deemed to be “high risk”, a variety of measures can be put into place to mitigate these risks. Significant foresight and planning is required, however, to ensure that these mitigation practices are effective..
Reliance Risk: The Perils of Overdependence
Reliance risk refers to how heavily or broadly an organization depends on a given model for decision-making. While similar to exposure risk, reliance risk focuses more on the degree to which an organization integrates a model into its operations, rather than the direct financial impact of errors.
Consider a predictive econometric model used for financial forecasting. While the model itself may not trigger immediate financial transactions, if its predictions inform broader business strategies, a flawed model can lead to poor investment decisions or operational inefficiencies. Similarly, reliance risk is particularly high when a model is used as an input into other critical systems.
To mitigate reliance risk, best practices include:
Model redundancy and alternative decision pathways: Avoid sole reliance on a single model by using complementary models or expert judgment.
Continuous performance monitoring: Deploy real-time monitoring to detect model drift and unexpected deviations.
Periodic reassessment and recalibration: Regularly update models to reflect new data trends and avoid reliance on outdated assumptions.
Generative AI presents unique challenges in reliance risk. If an organization incorporates AI-generated content into the evaluation of legal documents, contracts, or in the execution of risk assessments for example, their reliance on potentially non-factual outputs could have serious consequences.
Organizations should employ rigorous quantitative review processes comparable to the level of their reliance risk for a given model, as well as human validation checkpoints, to ensure model outputs are trustworthy for any large-scale roll-out.
Uncertainty Risk: The Black Box Problem
Uncertainty risk pertains to the inherent transparency and interpretability of a model. For example, traditional statistical models, such as logistic regression or decision trees, provide clear, interpretable outputs. However, more complex machine learning models—especially deep learning and neural networks—often act as black boxes, making it difficult to understand how decisions are made.
This issue is even more pronounced in Generative AI models, where outputs are not deterministic and may be difficult to validate. A large language model (LLM), for instance, generates responses based on training data, but it is often challenging or impossible to trace the reasoning behind specific outputs. This opacity increases the risk of biased, misleading, or incorrect content being generated.
Best practices for managing uncertainty risk include:
Explainability and interpretability tools: Utilize techniques such as SHAP (Shapley Additive Explanations) and LIME (Local Interpretable Model-agnostic Explanations) to provide insights into model behavior. While these techniques are well suited to evaluate the influence of structured model input variables associated with traditional statistical, machine learning, and even some deep learning analyses, they have limited or no ability to provide insights into the influence of unstructured data/variables inputted into Generative AI models.
Robust documentation and audit trails: Maintain clear documentation of model design, training data, and key decision points to improve transparency.
Human-in-the-loop oversight: Implement checkpoints where humans validate high-risk model outputs before they influence key decisions.
For Generative AI, uncertainty risk requires even more stringent controls. AI-generated content should always be flagged as such, and companies should implement review layers to assess factual accuracy, bias, and appropriateness.
Extending Traditional Model Governance to Generative AI
While the financial services industry has long applied these governance principles to traditional models, the rise of Generative AI requires adapting and extending these frameworks. GenAI models present innately high uncertainty risks by default, and their exposure and reliance risks vary depending on their applications.
To align with best practices, organizations should:
Adopt structured governance frameworks: Implement and use well established and traditional model risk management principles and apply them to GenAI.
Ensure appropriate AI model explainability: As much as the end-application needs dictate, leverage models that are sufficiently explainable. While this can be extremely challenging when dealing with GenAI models, leverage research on explainable AI (XAI) to enhance transparency in generative models. Balance the explainability of your model with the implications of your model’s Exposure and Reliance
Implement safeguards against hallucinations: Generative models can create false or misleading information, requiring mechanisms to validate and fact-check outputs.
Conclusion
The governance of AI and machine learning models is a critical discipline, especially as organizations increasingly depend on AI-driven decision-making. By leveraging the well-established principles of Exposure, Reliance, and Uncertainty risk—developed in the financial services industry—businesses can effectively manage both classical ML models and the emerging risks posed by Generative AI.
Companies that adopt these best practices will be better positioned to navigate regulatory landscapes, mitigate financial and reputational risks, and build trust in AI-powered systems.
About VentureArmor
If your organization is looking to strengthen its AI model governance infrastructure, VentureArmor AI is here to help. We specialize in setting up governance frameworks, establishing model risk protocols, and conducting comprehensive AI audits. Our analytical leads have led similar functions at several of the largest and most heavily regulated Financial Services companies in the US. Contact us today to learn more about how we can support your AI governance needs.
At VentureArmor, we specialize in helping businesses unlock the power of AI to drive operational excellence and customer satisfaction. Our expertise in AI analytics and data-driven solutions enables us to deliver tailored solutions that meet the unique needs of our clients. Contact us to learn more about how we can help your organization achieve its goals through the strategic application of AI. VentureArmor: Delivering ROI with AI.
Marketing has always relied on data to make informed decisions, but the advent of advanced analytics has redefined how data can be leveraged to drive impactful outcomes. While traditional marketing analytics methods have served their purpose for decades, advanced analytics introduces a new paradigm—offering deeper insights, better personalization, and enhanced efficiency.
This article explores the types of marketing analytics needed to support a modern advanced analytics-enhanced marketing program, contrasting these approaches with traditional techniques and highlighting the incremental benefits of advanced analytics driven solutions.
Traditional Marketing Analytics vs. Advanced Analytics
Traditional marketing analytics often relied on historical data and qualitative or minimally quantitative approaches. These methods were often sufficient for broad insights but fell short of providing granular, actionable recommendations.
For example, traditional heuristic-driven segmentation methods often grouped customers into broad qualitatively derived and often ill-conceived categories. Similarly, most traditional campaign response analytics contain minimal quantitatively grounded insights connecting past behavior and future actions.
These approaches all lie relatively low on the Analytics Maturity curve; in the “Descriptive Analytics” region where the basic reporting on “what happened?” or “what’s happening?” takes place. Our full discussion of the Analytics Maturity curve can be found here.
Advanced Analytics, in contrast, introduces AI and machine learning (ML) tools capable of investigating vast datasets, identifying nuanced patterns, and adapting to new information in real time. Moreover, these new advanced analytics based approaches provide insights that extend well beyond the capabilities of traditional methods, and are capable of delivering Diagnostic, Predictive, and Prescriptive insights that enable organizations to optimize their decision making towards desired outcomes.
Let’s dive into the different types of analytics that underpin traditional marketing programs, and discuss the way that new advanced analytics enhanced tools can provide enhanced utility.
Market Basket Analysis
Market basket analysis is a data mining technique that identifies patterns in customer purchasing behavior by analyzing which items are frequently bought together.
Traditional Approach: Market basket analysis approaches have varied significantly over the years. Even today, many companies employ heuristic-based approaches to determine “market baskets”. In this approach, they set arbitrary thresholds for item combinations (e.g., “if two items are bought together more than 5% of the time, they are considered associated”). Other market basket analysis approaches simply involve manually examining transactional data for obvious patterns, such as which items were frequently bought together. This is a labor-intensive process, often relying on visual inspection or simple frequency counts to identify popular item pairs or combinations (like observing that milk and bread are often bought together).
Advanced Analytics Enhanced Approach: Since the late 1990’s, market basket association rules (e.g., “If a customer buys X, they’re likely to buy Y”) have often been identified using statistical methods like Apriori calculations. While more of a data-mining approach, we still categorize it under the much larger Advanced Analytics taxonomy umbrella. More recently, other more efficient AI-powered market basket analysis techniques have become available. ML algorithms like FP-Growth and AI-driven Deep Learning approaches can efficiently uncover complex relationships among products in larger datasets, and identify latent patterns across product categories that are invisible to traditional methods. Because of its efficiency and effectiveness, FP-Growth in particular is also commonly used in product recommendation systems; especially when dealing with large data sets.
Benefits: Advanced analytics transforms market basket analyses into higher-impact data driven tools, enabling marketers to design more effective cross-selling and up-selling strategies while enhancing the customer shopping experience.
Customer Segmentation Analysis
Customer Segmentation Analysis is the process of dividing a customer base into distinct groups based on shared characteristics, such as demographics, behaviors, or purchasing patterns, to tailor marketing strategies effectively
Traditional Approach: Traditional customer segmentation logic often relied on qualitative business-defined heuristics as a means for defining which customers belonged to which sub-population groups. With these often meaningless definitions in-hand, marketers would then attempt to aggregate data accordingly, often deriving incorrect insights in the process; thus delivering marketing campaigns that invariably underperformed.
Advanced Analytics Enhanced Approach: Advanced analytics based segmentation uses clustering algorithms and unsupervised learning to create more granular and dynamic data-driven and data-derived segments. For instance, various advanced analytics techniques can incorporate behavioral data, psychographics, purchase history, and hundreds or thousands of other variables to identify relevant clusters , segments, micro-segments with shared characteristics. These segments, which are amalgamations of the insights each of the variables included in their construction delivers, are a more accurate and true reflection of the dynamic nature of the segments in a given customer population.
Benefits: Advanced analytics empowers marketers to target segments with hyper-personalized campaigns, improving engagement and conversion rates. Real-time segmentation also allows brands to adapt strategies as customer behaviors shift.
Predictive Analytics for Response Rates
Predictive Analytics for Response Rates uses historical data and machine learning models to forecast the likelihood of a customer responding to a marketing campaign.
Traditional Approach: Traditional response rate analyses are focused on historical campaign performance, often using historical response rate averages as a basis for determining the expected response rate for future campaigns. While expedient, this approach doesn’t provide marketers with the insights needed to understand how different marketing messages, sent to different customer groups, can derive different response rates. Understanding the nature of these relationships is foundational to effective modern marketing campaign design and execution.
Advanced Analytics Enhanced Approach: Advanced analytics takes response rate analysis further with predictive models like gradient boosting and neural networks. These models analyze large quantities of historical data alongside real-time inputs to predict not only who is likely to respond but also when and how they will respond.
Benefits: Predictive analytics powered by AI and Machine Learning (ML) enables marketers to optimize campaign timing, content, and delivery channels for maximum ROI. It also reduces wasted marketing spend, by focusing available marketing dollars on higher-value prospects.
Customer Lifetime Value (CLV) Analysis
Customer Lifetime Value (CLV) Analysis estimates the total revenue a business can expect from a customer throughout their relationship.
Traditional Approach: Calculating CLV traditionally relied on simple formulas involving average purchase value, frequency, and customer retention rates. Again, while this approach is expedient, it misses the deeper value focused nuances intrinsic to any given customer population.
Advanced Analytics Enhanced Approach: Advanced analytics based models integrate multiple data points, such as transaction history, engagement metrics, and external market conditions, as well as other model derived outputs, to forecast CLV accurately and dynamically. Reinforcement learning can even simulate the long-term impact of different marketing interventions on CLV.
Benefits: Advanced analytics driven CLV analysis helps marketers identify high-value customers early, prioritize retention efforts, and allocate resources more effectively.
Churn Prediction
Churn Prediction identifies customers at risk of ending their relationship with a business by analyzing behavioral patterns, engagement levels, and transaction history.
Traditional Approach: Marketers traditionally identified churn risks using threshold-based manual analyses of historical purchasing trend patterns. For example, business rule driven consideration of factors like inactivity or customer complaints have often been used as early flags of potential churn.
Advanced Analytics Enhanced Approach: Advanced analytics models, such as random forests and deep neural networks, can analyze complex, non-linear relationships among variables to predict churn with greater accuracy. Natural language processing (NLP) can also analyze customer feedback to identify dissatisfaction signals.
Benefits: By accurately predicting churn, advanced analytics enables proactive retention strategies, such as personalized offers or interventions, to retain at-risk customers.
Sentiment Analysis
Sentiment Analysis uses natural language processing (NLP) and machine learning to evaluate customer opinions, emotions, and attitudes from text, speech, or social media data.
Traditional Approach: Sentiment analysis historically involved manual review or basic keyword analysis of customer feedback, reviews, or social media posts. This traditional approach is time consuming, expensive, error prone, and not scalable to any large degree.
Advanced Analytics Enhanced Approach: With advanced analytics, sentiment analysis leverages NLP and deep learning to interpret text, audio, and even visual data at scale. Advanced analytics based AI can detect nuances like sarcasm or mixed sentiments, providing a more comprehensive understanding of customer attitudes.
Benefits: Advanced analytics powered sentiment analysis helps brands stay ahead of reputation risks, understand customer sentiment in real time, and adjust messaging to align with public perception. More details on VentureArmor’s work in the Sentiment Analysis space can be found in this case study.
Marketing Mix Modeling (MMM)
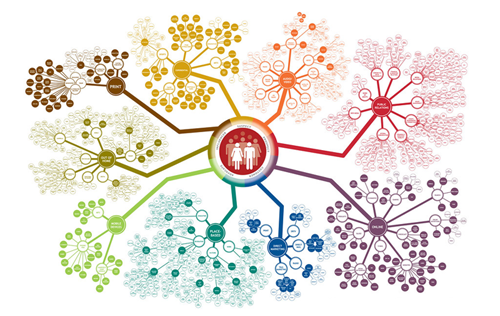
Mullen Marketing Ecosystem
Marketing Mix Modeling (MMM) analyzes the impact of various marketing channels, such as digital ads, TV, and promotions, on sales and business performance.
Traditional Approach: Traditional MMM relied on reporting related to historical response rates for different customer segments, across different market channels, to determine the optimal marketing mix. Given that many of these customer segment definitions are qualitatively derived and sub-optimal, and that the connections between these segments and marketing performance is also qualitatively characterized… optimizing marketing mix has traditionally been very difficult.
Advanced Analytics Enhanced Approach: Advanced analytics enabled MMM uses ML to process more granular data and account for non-linear interactions among variables. These models continuously learn and adapt, providing more accurate and actionable insights, across customers, customer segments, products, prices, and promotions.
Benefits: Advanced analytics powered MMM allows marketers to dynamically determine the optimal selection of marketing channel and marketing messaging for each customer, across channels dynamically, ensuring the best possible return on investment.
Dynamic Pricing Analysis
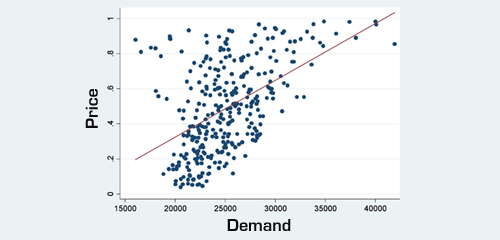
Dynamic Pricing Analysis involves adjusting product or service prices in real time based on factors like demand, competition, and customer behavior. Please see our deeper-dive discussion on Pricing here.
Traditional Approach: Traditional approaches to pricing often involve manual examination of historical data, and a heuristic driven approach to price setting, based largely on Descriptive analytics (see Analytics Maturity Curve mentioned above).
Advanced Analytics Enhanced Approach: Advanced analytics algorithms analyze real-time market conditions, competitor actions, customer behaviors, and potentially hundreds or thousands of other factors to determine optimal pricing strategies. Reinforcement learning can also simulate customer reactions to pricing changes.
Benefits: Advanced analytics driven pricing ensures competitiveness, maximizes revenue, and improves customer satisfaction by offering fair and timely pricing.
Bringing it all together: A Sum Greater Than Its Parts
By integrating the outputs of various Advanced analytics driven models—such as customer segmentation, churn prediction, and sales forecasting—marketers can unlock synergies that deliver results far beyond the individual contributions of each model.
By integrating the outputs of various advanced analytics driven models—such as customer segmentation, churn prediction, and sales forecasting—marketers can unlock synergies that deliver results far beyond the individual contributions of each model.
For instance, combining customer segmentation with churn prediction can identify high-risk segments and personalize retention efforts more effectively. Similarly, predictive sales forecasting can inform dynamic pricing models, ensuring that real-time price adjustments align with demand fluctuations and customer behavior.
The true power in an Advanced Analytics / AI-driven approach lies in the ability to merge these insights into a cohesive strategy, where the models work together to drive a more personalized, efficient, and optimized marketing operation. In doing so, AI doesn’t just enhance individual processes but supercharges entire marketing ecosystems, generating value that amplifies each component’s impact.
The Incremental Benefits of Advanced Analytics
Advanced Analytics provides several benefits over traditional approaches:
Scalability: Advanced analytics based AI and Machine Learning (ML) tools can analyze massive datasets in seconds, providing insights that were previously unattainable.
Adaptability: Machine learning models evolve with new data, ensuring relevance in dynamic markets.
Personalization: Use of Advanced Analytics techniques enables hyper-personalized marketing, improving customer engagement and loyalty.
Efficiency: Automating repetitive tasks allows marketers to focus on strategy and creativity.
In a world where data is a competitive advantage, Advanced Analytics / AI / ML driven marketing analytics offers organizations the tools they need to stay ahead. By embracing these advanced techniques, businesses can unlock new opportunities, deliver exceptional customer experiences, and achieve sustainable growth.
The evolution of marketing analytics is not just about adopting new tools—it’s about transforming how we think about data, customers, and the future of marketing.
About VentureArmor
At VentureArmor, we specialize in helping businesses unlock the power of AI to drive operational excellence and customer satisfaction. Our expertise in AI analytics and data-driven solutions enables us to deliver tailored solutions that meet the unique needs of our clients. Contact us to learn more about how we can help your organization achieve its goals through the strategic application of AI. VentureArmor: Delivering ROI with AI.
Pricing plays a crucial role in the success of any business, whether in retail or wholesale. The strategies behind retail and wholesale pricing vary, as they cater to different segments of the supply chain. Wholesale pricing is focused on selling goods in large quantities to retailers or other businesses, while retail pricing targets end consumers. Let’s explore how these pricing strategies are determined and the factors influencing them.
Background: Understanding Retail and Wholesale Pricing
Wholesale Pricing
Definition: Wholesale pricing is the price set by manufacturers or distributors when selling products in bulk to retailers, resellers, or other businesses.
Key Elements of Wholesale Pricing:
Cost of Goods Sold (COGS): The starting point for any wholesale price is the COGS, which includes the cost of raw materials, manufacturing, labor, and overhead expenses. A wholesaler must ensure the wholesale price covers these costs to maintain profitability.
Profit Margins: Wholesalers add a profit margin to the COGS to determine the final price. Typical wholesale profit margins range from 15% to 50%, depending on the industry, product, and competition.
Volume Discounts: Wholesalers often offer tiered pricing based on order size. Larger orders receive steeper discounts, incentivizing bulk purchases and fostering long-term business relationships.
Market Trends and Competition: Wholesale pricing must be competitive. Businesses frequently analyze industry trends, competitor pricing, and customer demand to adjust their prices while maintaining profitability.
Logistics and Distribution Costs: Shipping, storage, and handling fees are incorporated into the wholesale price. Businesses may either pass these costs to the retailer or absorb them, depending on their strategy.
Traditional Heuristic Methods for Setting Wholesale Prices:
Keystone Pricing: A common wholesale pricing strategy where the cost is doubled (COGS × 2) to establish the wholesale price. This method works well in industries with stable costs and predictable demand. This pricing approach traces back to the jewelry trade in the late 19th century. A publication named ”The Keystone” introduced the concept to jewelers
Cost-Plus Pricing: Adding a fixed percentage or dollar amount to the COGS ensures profit margins are met.
Competitive Pricing: Businesses analyze competitor pricing and set their wholesale prices slightly below or within the same range to attract buyers.
Retail Pricing
Definition: Retail pricing is the price charged to consumers for a product or service. This price is typically higher than the wholesale price to account for operating costs and other expenses.
Key Elements of Retail Pricing:
Wholesale Cost: Retail pricing begins with the wholesale cost—the price paid by the retailer to acquire the product.
Operating Expenses: Retailers factor in expenses such as rent, utilities, wages, marketing, and inventory management. These costs vary widely depending on the business size and location.
Markup: The markup is the amount added to the wholesale cost to cover operating expenses and ensure profitability. Markups can vary significantly, with some industries operating on slim margins (e.g., grocery stores) and others with higher margins (e.g. luxury goods).
Consumer Demand: Retail pricing must reflect the perceived value of the product. High demand or unique products may justify higher prices, while excess inventory or competitive markets may necessitate price reductions.
Psychological Pricing: Strategies like setting prices at $19.99 instead of $20.00 can influence consumer behavior. This approach leverages consumer psychology to make products appear more affordable.
Traditional Heuristic Methods for Setting Retail Prices:
Keystone Markup: Retailers double the wholesale price (Wholesale Price × 2) to determine the retail price.
Manufacturer’s Suggested Retail Price (MSRP): Some manufacturers provide a recommended retail price, ensuring consistency across retailers. This approach is common in electronics, automotive, and branded goods.
Discount Pricing: Temporary reductions, sales, or promotions attract customers and increase volume sales. Retailers must balance discounts with profit margins to avoid losses.
Comparing Wholesale and Retail Pricing
Wholesale Pricing
Retail Pricing
Target Audience
Businesses, resellers, retailers
End consumers
Volume
High-volume sales
Low-volume, individual sales
Profit Margins
Lower margins
Higher margins
Complexity
Focused on production and distribution costs
Accounts for consumer behavior and marketing
Adjustability
Based on contracts and bulk orders
Flexible for promotions, demand, and seasons
Challenges in Pricing
When wholesalers and retailers set prices, they need to keep a myriad of simultaneous considerations in mind, as they attempt to achieve their desired outcomes (e.g. profit maximization) while still operating within certain constraints (e.g. in-stock levels, sales volumes, and more). Some of these considerations include:
Balancing Profitability and Competitiveness: Both wholesalers and retailers must strike a balance between offering competitive prices and maintaining healthy profit margins.
Economic Fluctuations: Inflation, currency fluctuations, and changes in raw material costs impact pricing strategies.
Market Saturation: High competition may force businesses to lower prices, affecting profitability.
Evolving Consumer Preferences: Retailers, in particular, must adapt to changing trends, preferences, and purchasing power.
Ever Changing Competitive Pressures: The constantly changing competitive environment that both wholesalers and retailers operate in can rapidly shift customer demand. This is true in terms of competitive price changes, competitor discounts and promotions, and competitor geographic positioning (Store and DC locations).
Supply Chain: The changing availability of products within the supply chain at various times can affect both wholesaler and retailer ability to stock and sell products.
Setting the right price for a product, with the right discount type (if any), at the right discount amount (if any), given the myriad of the above considerations for any given product, being sold at any given location can be EXTREMELY complicated. Hundreds or thousands of variables need to be simultaneously considered, to make an optimized decision. Finding this massively multi-dimensional balance via manual means is physically impossible.
Setting the right price for a product, with the right discount type (if any), at the right discount amount (if any), given the myriad of the above considerations for any given product, being sold at any given location can be EXTREMELY complicated. Hundreds or thousands of variables need to be simultaneously considered, to make an optimized decision. Finding this massively multi-dimensional balance via manual means is physically impossible. This is why companies have turned to AI and large-scale compute to help solve these otherwise intractable problems.
Modern Pricing: Tackling Problem Complexity with AI
AI-based analytics can provide businesses with actionable insights to address pricing challenges effectively, enabling data-driven pricing strategies that maximize decision making at the multi-dimensional intersections between profitability, customer satisfaction, and hundreds/thousands of other considerations.
Problem Complexity
To illustrate the complexity of the problem space, consider the following. If one wanted to understand demand dynamics for a product by considering just one variable, the price charged for that product and the resulting demand, producing an X-Y scatter plot of this relationship might look something like this:
Interaction Between 2 Variables (2 Dimensions): Demand and Price
While this is perhaps a good starting point for analysis, given the relatively diffused spread of the dots in this graph, there appears to be a lot going on that is not explained by just considering price alone. What if we were to include another variable, discount amount? If we did, then the graph might look something like this:
Interaction Between 3 Variables (3 Dimensions): Demand, Discount, Price
This appears to be an improvement, and we can use this visual to get a better impression of the complexity of the space. In this visual, we can see certain combinations of price and discounts that yield localized demand benefit (Local Maximums), and other points that globally seem to be the best combination of price and discount (Global Maximums). It is important to note that while the above illustration might represent a true visualization of the historical relationship between these three variables, the applicability of this characterization to future demand forecasts would be probabilistic. Said differently, imagine a fuzzy/blurry version of the above surface, where the projected demand at any given discount and price combination would be found in that haze.
Ultimately, pricing decision makers want to reduce the amount of fuzziness in this probability surface. To accomplish this, decision makers often introduce additional variables/dimensions into the analytical process – sometimes hundreds or thousands of additional variables – in an attempt to capture the influences of those variables on demand dynamics. Doing this produces a complex massively multidimensional surface, with hundreds or thousands of dimensions, that is impossible to visualize, and extremely difficult to explore, to find the optimal pricing/other points within.
Despite the challenges involved in exploring this massively multidimensional space, there are two ways that businesses analytically approach this complexity: 1) Price Elasticity based analytics and 2) Dynamic/Real-Time Pricing based analytics.
Option 1:Price Elasticity & Outcome Simulation
By analyzing historical sales data, businesses can build AI models to understand how changes in price, discount type, discount amount, promotion, shelf placement, and more can affect demand for their products, in the context of the myriad of other operational considerations that can impact demand.
Once these AI models are built, other AI tools can be employed to explore the dynamics of the relationships between the variables represented within the model. You can think of it like a switchboard with dozens/hundreds/thousands of dials; each dial representing a different variable or decision factor for a business, and the settings for this dial being the different values that could be set for this variable. The machine behind the switchboard is the model. The dials are the controls for the model (i.e. the various price, discount, and other decision factors a business can make). Finding the optimal setting for each dial, such that an optimized outcome is produced, can be extremely complex. However, AI can be used to intelligently and efficiently explore the various possibilities very quickly, and achieve optimized “dial” recommendations.
Again, taking this approach entails implementing 1) An AI-based representation of the relationship between demand and other factors for a given product or set of products, and 2) The technical ability to intelligently explore the dynamics of this model, to find the optimal decision points. Both of these builds can be complex. While this approach can produce very robust and valuable insights, building and maintaining AI models that are accurate representations of business dynamics can be a significant undertaking. Because of these challenges, some businesses choose to take a different approach: Dynamic/Real-Time Pricing.
Option 2:Dynamic / Real-Time Pricing
Dynamic pricing optimization can be implemented via a number of often very expensive proprietary applications. These systems use decision-making algorithms to determine the most appropriate price for a product or service in real time, based on dynamic A/B testing.
While no master AI model is often produced by these systems, the incremental probability of certain customers acquiring certain products is computed (ex: Naïve Bayes), and is used to incrementally optimize future pricing and offer presentment decisions. Here’s how it works:
A/B Testing and Experimentation
Optimization within these systems are based on large scale dynamically designed and executed A/B testing experiments, each reflecting different pricing and offer presentment strategies across different scenarios, to achieve optimal outcomes. Businesses can test varying price points, discounts, or bundles to identify the most effective approach for driving conversions and maximizing revenue across different situations.
Real-Time Decisioning
These systems leverage real-time decision-making to dynamically adjust pricing for individual customers. They consider data such as current demand, customer interactions, and external market conditions to suggest the best price at any given moment.
For instance, if a customer shows interest in a product but hesitates to purchase, the system might offer a discount or promotional price to nudge them toward conversion.
Personalization at Scale
Using its customer profile and interaction history, these systems personalize pricing strategies for individual customers. Factors like purchase history, loyalty status, and willingness to pay (inferred from past behavior) influence the pricing recommendations.
Example: A loyal customer might receive a lower price or bundled offers, whereas a new customer may be shown a standard or premium price.
These types of systems are often used to manage product and offer presentment on websites, where real-time feedback can be readily obtained. They can also be used to manage offline brick-and-mortar aspects of sales as well.
Summary
Advanced wholesale and retail pricing involves navigating the complexities of setting optimal prices for businesses and consumers. While wholesale pricing prioritizes bulk sales with considerations like COGS, profit margins, and volume discounts, retail pricing focuses on consumer demand, psychological pricing, and operational expenses. Traditional heuristic methods, such as keystone or cost-plus pricing, have been effective, but modern AI-driven approaches are increasingly driving pricing decisions in business.
Competing effectively against these automated and AI driven systems by manual means is simply not possible. They will beat human-based decisions 999 times out of 1000.
Competing effectively against these automated and AI driven systems by manual means is simply not possible. They will beat human heuristic-based decisions 999 times out of 1000. The human minds is not able to factor-in the hundreds or thousands of considerations needed to optimize outcomes, while simultaneously balancing other operational constraints. There are simply too many “dials and levers” to consider. While this kind of complexity is still a challenge even for computers, it is a challenge that they are particularly adept at tackling.
By leveraging techniques like price elasticity modeling or dynamic/real-time pricing, however, businesses can optimize outcomes across a vast array of variables. These advanced methodologies enable smarter, data-driven decisions, maximizing profitability while meeting market and business demands.
About VentureArmor
At VentureArmor, we specialize in helping businesses unlock the power of AI to drive operational excellence and customer satisfaction. Our expertise in AI analytics, pricing, and data-driven solutions enables us to deliver tailored solutions that meet the unique needs of our clients. Contact us to learn more about how we can help your organization achieve its goals through the strategic application of AI. VentureArmor: Delivering ROI with AI.
For many businesses that want to move up the Analytics Maturity Curve , there’s a persistent myth that actionable insights can only emerge from pristine data. Business executives in these companies frequently dismiss their organization’s analytics potential, believing their data is too “dirty” or unreliable to power advanced insights.
The truth, however, is that no dataset is ever perfect. Every organization’s data exists on a spectrum of cleanliness, from highly structured and accurate to chaotic and inconsistent. With the right techniques however, data scientists can extract highly valuable insights, even from flawed datasets. Success lies in understanding the data, preparing it effectively, and validating models rigorously. This final step, Validation, is the key to the whole endeavor. Let’s start at the beginning of the process however, and discuss how these insights are distilled.
Defining the Business Problem
The journey to actionable insights begins with a clear definition of the problem. Without clarity, even the cleanest data and most sophisticated models will fail to deliver meaningful outcomes.
For instance, consider a company aiming to optimize customer acquisition. A well-defined problem might involve predicting which customer segments are most likely to occupy the intersection of maximal profit generation and maximal response rate, vs. simply looking at which ones are most likely to respond to a new marketing campaign. Moreover, diving deeper, spending sufficient time to clearly define what is meant by “profit”, and obtaining consensus on both its calculation and the attribution rules that feed into it are critical. Note that these steps, while foundational, do not involve AI; but instead properly frame the business problem, which in turn helps guide the selection and curation of both independent and dependent variables.
“A problem well stated is half solved”
As the old adage goes, “A problem well stated is half solved.” Starting with the end goal in mind ensures that the subsequent steps—data preparation, model construction, and validation—are all aligned.
Preparing Data for Model Construction
Before diving into model construction, data preparation is critical. Poorly prepared data can skew results, obscure patterns, and undermine the reliability of predictive models. Here are several key steps in data preparation:
1. Handling Outliers
Outliers—extreme values that deviate significantly from the rest of the data—can distort statistical measures and model predictions. Data scientists use techniques such as:
Winsorization: Capping extreme values at a certain percentile.
Transformation: Applying logarithmic or square root transformations to minimize the impact of outliers.
Exclusion: Removing outliers when justified by the context.
2. Addressing Skewness
Many real-world datasets exhibit skewness, where data is unevenly distributed. Left unaddressed, skewness can bias models. Common remedies include:
Log Transformation: Reducing skewness by compressing larger values.
Normalization: Scaling data to a uniform range.
Power Transformation: Adjusting the distribution to approximate normality.
3. Sampling Challenges
Sampling is an essential step, particularly when working with large datasets. However, poor sampling can introduce biases or result in unrepresentative data. To mitigate this:
Random Sampling ensures each data point has an equal chance of selection.
Stratified Sampling maintains proportional representation of key subgroups.
Oversampling addresses imbalances, especially in datasets with rare events, such as fraud detection.
4. Feature Selection and Engineering
Data scientists often eliminate irrelevant variables (features) and create new ones to enhance predictive accuracy. Techniques like Principal Component Analysis (PCA) help reduce dimensionality, while domain knowledge guides the creation of new features that capture meaningful relationships.
Assessing Quality and Building Trust Through Data Sampling& Validation
Once the data is prepared, assessing its quality is paramount. This is often achieved through random sampling techniques that split the data into two subsets:
1. Build Sample
The build sample is used to train machine learning or AI models. By exposing the model to historical data, it learns patterns and relationships between inputs (independent variables) and the target output (dependent variable).
2. Holdout Sample
The holdout sample serves as an independent test data set, untouched during model training. The model’s predictions on this sample are compared against actual known outcomes, providing a measure of its predictive accuracy.
The Holdout Sample is the key to providing confidence in the model construction process. When a model that is constructed on the build sample is applied to predict known values within the holdout sample, it becomes easy to see how accurate the model is. If the model does a good job at making accurate predictions within this hold out sample, then one can be reasonably assured that it will continue to do a good job, for a time, on other more general data. More on Model Governance Here. There are several ways to evaluate the accuracy of a model’s predictions:
Validating the Model
Validation ensures that the model is both reliable and generalizable. Key metrics for evaluating performance on the holdout sample include:
1. R-Squared (R²)
A measure of how well the model explains the variance in the data. An R² close to 1 indicates a strong fit, though overly high values can signal overfitting.
2. Mean Absolute Error (MAE) and Mean Squared Error (MSE)
These metrics evaluate the average magnitude of prediction errors. MAE provides a straightforward average, while MSE penalizes larger errors more heavily.
3. Precision, Recall, and F1 Score
For classification problems, these metrics assess the model’s ability to correctly identify positive outcomes while avoiding false positives and negatives.
4. Area Under the Curve (AUC)
In binary classification tasks, the AUC measures the model’s ability to distinguish between classes across various decision thresholds.
5. Residual Analysis
Examining the differences between predicted and actual values can reveal biases or patterns that the model failed to capture.
What Constitutes a “Good” Model in Business?
In business, particularly in financial services, a “good” model doesn’t need to explain all variation in the target variable to deliver significant value. For example, when developing marketing targeting models within financial services, it is not uncommon for a model with an adjusted R-squared of 30% to 40% to be considered sufficiently “good”, and be profitably operationalized. While such models can explain only a minority of the variance (30% – 40%) in the dependent variable, they can still drive millions of dollars in revenue and profit; despite the inaccuracies and other problems that exist in the data that went into building the model.
Finding a Balance
Aligning model performance with organizational risk appetite is one of the most important steps in model operationalization. This involves understanding the balance between predictive power and acceptable risk, ensuring that models deliver value while managing potential downsides effectively. More on this topic here.
“If one’s data is fully and irredeemably flawed or irrelevant, the probability of producing a model with any kind of predictive capacity is exactly zero. Said a different way, if a model is able to account for at least some amount of variation in the dependent variable, then it may be at least partially useful.”
If one’s data is fully and irredeemably flawed or irrelevant, the probability of producing a model with any kind of predictive capacity is exactly zero. Said a different way, if a model is able to account for at least some amount of variation in the dependent variable, then it may be at least partially useful. The level of usefulness will depend on 1) the value a correct prediction delivers to the organization, 2) the cost that an incorrect prediction potentially incurs, and 3) the degree to which a model is able to provide correct predictions. There will always be a cut-off point in model performance, for any given model application, below which organizations are unlikely to be able to profitably deploy a model.
Again, given an organization’s risk appetite, and an understanding of the potential up-side and down-side associated with taking action on a model recommendation, a balance can be struck.
Conclusion
Dirty data is not a dead end—it’s a starting point. By applying robust preparation and validation techniques, organizations can extract meaningful, actionable insights from imperfect datasets. While the journey requires effort and expertise, the rewards—smarter decisions, innovative solutions, and a competitive edge—are well worth the investment.
The challenge lies not in achieving perfection but in applying the right tools and technique capable of sifting through the mess, to find the gold hidden within. With the right approach, even the dirtiest data hold the possibility of being transformed into a powerful tool for driving business success.
About VentureArmor
At VentureArmor, we specialize in helping businesses unlock the power of AI to drive operational excellence and customer satisfaction. Our expertise in AI analytics and data-driven solutions enables us to deliver tailored solutions that meet the unique needs of our clients. Contact us to learn more about how we can help your organization achieve its goals through the strategic application of AI. VentureArmor: Delivering ROI with AI.
Organizations striving for data-driven decision-making often follow a journey along an analytical maturity curve. This maturity curve represents the stages through which businesses progress as they leverage data to generate increasing levels of value. Each stage reflects a greater degree of sophistication, moving from basic descriptive analysis to advanced predictive and prescriptive analytics.
Understanding each stage of the curve allows organizations to assess their current capabilities, prioritize investments, and strategically advance toward more impactful insights. Let’s explore the stages of the analytical maturity curve, what they entail, and the value they provide.
Descriptive Analytics: Understanding What Happened
At the descriptive stage, organizations focus on analyzing historical data to understand past events. All businesses begin in this phase. Businesses first start with raw data. Next they typically spend a great deal of time endeavoring to clean this data. Finally, businesses typically build reporting systems to summarize this data . The descriptive analytics stage of the maturity journey serve as the foundation of all later analytics. These steps seek to answer questions such as:
What happened?What’s happening?
How many customers purchased a product?
What was the revenue last quarter?
Characteristics:
Data Sources: Structured data from spreadsheets, databases, or basic reporting systems.
Tools: BI dashboards, Excel, or SQL-based reports.
Key Activities: Data aggregation, summarization, and visualization.
Output: Static reports, charts, and dashboards that provide clarity on past performance.
Business Value:
Descriptive analytics delivers insights to monitor performance, identify trends, and measure outcomes. However, its value is limited to retrospective analysis—it explains what happened but not why.
Diagnostic Analytics: Explaining How Things that Happened Are Related
Building on descriptive analytics, diagnostic analytics dives deeper to uncover the root connections and relationships between variables associated with events, past or present. It answers questions such as:
What variables are associated with the sales drop last quarter?
Which factors are associated with an increase in customer churn?
Characteristics:
Data Sources: Structured and semi-structured data; often involves drilling into more granular data points.
Tools: Statistical and machine learning analysis software.
Key Activities: Correlation analysis, segmentation, and regression analysis.
Output: Insights explaining relationships between variables and identifying underlying relationships.
Business Value:
Diagnostic analytics empowers organizations to understand the dynamics behind key trends, enabling more informed decision-making. By explaining connections between events that occurred, businesses can begin to identify opportunities for improvement.
Predictive Analytics: Forecasting What Will Happen
In the predictive stage, organizations leverage statistical models and machine learning techniques to forecast future outcomes based on historical patterns. Predictive analytics answers questions such as:
What is the likelihood of a customer churning?
How will sales trend next quarter?
Which customers are most likely to purchase a new product?
Characteristics:
Data Sources: Structured data is used for this analysis, which can itself be the end product of the analyses of semi-structured and unstructured data.
Key Activities: Data Prep and Sampling, Model Building, Testing, and Validation.
Output: Forecasts, probabilities, and risk scores.
Business Value:
Predictive analytics enables organizations to anticipate trends, risks, and opportunities. By leveraging historical data to predict outcomes, businesses can proactively address issues, optimize strategies, and make forward-looking decisions.
Prescriptive Analytics: Determining How To Optimize What Happens
At the pinnacle of the maturity curve is prescriptive analytics. This stage focuses on providing actionable recommendations and optimizing decision-making. It answers questions such as:
What is the best course of action?
How can we allocate resources to maximize efficiency?
Which strategy will yield the highest ROI?
Characteristics:
Data Sources: All available data types, often in real-time.
Tools: Optimization algorithms, AI models, simulation tools, and decision support systems.
Key Activities: Scenario analysis, optimization modeling, and AI-driven decision-making.
Output: Actionable insights, recommended strategies, and automated decision workflows.
Business Value:
Prescriptive analytics delivers the highest level of value by not only predicting future outcomes but also recommending actions to achieve desired results. This empowers businesses to optimize resources, improve efficiency, and drive strategic initiatives with confidence.
Moving Up the Analytical Maturity Curve
Progressing along the maturity curve requires investments in technology, data infrastructure, and skills. Key enablers include:
Data Management: Reliable data sources, integration across systems, and strong governance.
Technology Stack: Tools and platforms for visualization, machine learning, and decision support.
Talent: Skilled analysts, data scientists, and decision-makers to interpret and act on insights.
Culture: A data-driven mindset where decisions are grounded in analytics.
Organizations must align their analytical ambitions with their resources and capabilities. Not every organization needs to reach prescriptive analytics immediately, but incremental progress ensures increasing business value over time.
Where Do LLMs Fit into the Analytical Maturity Curve?
GenerativeAI constructs like Large Language Models (LLMs), are transformative tools that primarily fall into the Descriptive and Diagnostic stages of the maturity curve. LLMs themselves are constructed through the analysis of vast amounts of unstructured and structured data and are a distillation of the relationships that exist within this data (Diagnostic analytics). Moreover, leveraging this distillation, they can be used to identify relationships, summarize information, and extract insights in new data fed to them. For example:
Descriptive: GenerativeAI can be used to help clean data. It can also be used with various degrees of success to generate summarizing reports and charts based on data inputs.
Diagnostic: GenerativeAI can also be used to identify basic trends and provide explanations of input data, based on comparisons to the large corpus of historical text data used to train the LLM or imported into the LLM.
While LLMs are not inherently Predictive or Prescriptive, nor can they reliably innately perform these more advance analytical functions, the value that they can provide in the Descriptive and Diagnostics phases of the maturity model can still be significant although often indirect; i.e. enabling the delivery of value by other systems and analytical functions. Regardless, the reason why so many organizations have struggled to leverage GenAI to deliver significant measurable business value is directly related to where they fall on this maturity / business value curve. They’re simply not currently able to reliably tackle the tougher business analytics challenges (pricing, optimization, forecasting, risk mgmt, etc) that deliver higher returns once solved.
The reason why so many organizations have struggled to leverage GenAI to deliver significant measurable business value is directly related to where they are positioned on this maturity / business value curve. They’re simply not currently able to reliably tackle the tougher business analytics challenges that deliver higher returns once solved.
It is worth noting, however that despite the fact that LLMs reside and operate in these lower maturity / business value nodes, they can and often do also act as catalysts for higher-level analytics. For instance:
In Predictive analytics, LLMs can support model prototyping by helping analysts generate code or refine models.
In Prescriptive analytics, LLMs can assist in scenario planning by simulating outcomes based on qualitative inputs.
As one moves up the maturity and business value curve, strong machine learning tools and analytical frameworks are needed to tackle the often extremely complex analytical challenges that exist in the Predictive and Prescriptive analytical domains. Please note that here, we categorize various kinds of traditional statistical analyses as being in the Machine Learning (ML) domain. These same ML tools can also be applied lower in the curve as well, in the Descriptive and Diagnostic domains to clean data, and summarize it within BI tools (eg: descriptive statistics), and analyze relationships (eg: correlation analyses).
Long-Term Outlook For GenAI – Agentic AI:
While LLMs themselves do not directly have the capabilities needed to perform Predictive and Prescriptive analyses, they will at some point in the near future be able to reliably call and manage the specialized machine learning tools needed to perform these kinds of more advanced analytics. In doing so, they will be able to deliver massive value at scale across the full range of analytics maturity nodes, including Prescriptive analytics. As of the time of this writing in December 2024 we’re not there yet, however.
This situation would be analogous to owning a humanoid robot that itself is incapable of cutting grass because it lacks a built-in grass trimming blade. However, if it were able to access a lawn mower, and could competently use it, not only could it mow lawns, but it could potentially mow lawns perfectly 24/7. With Agentic AI (i.e. relating to AI “Agents”), this is a possibility, and the implications are massive.
This touches in a small way on the very broad topic of Agentic AI, which are systems designed to autonomously pursue complex goals and workflows with limited direct human supervision. These AI constructs exhibit autonomous decision-making, planning, and adaptive execution using a variety of tools to complete multi-step processes. More on this topic in a later article.
Conclusion
The analytical maturity curve represents the evolution from understanding past performance to optimizing future decisions. Each stage—descriptive, diagnostic, predictive, and prescriptive—builds on the last, delivering greater value as sophistication increases. While LLMs are powerful tools for analyzing relationships within language and text, advancing to predictive and prescriptive analytics requires (for now) structured data, advanced tools, and a skilled workforce. By strategically progressing along this curve, organizations unlock the full potential of their data to drive impactful decisions and achieve sustainable growth.
About VentureArmor
At VentureArmor, we specialize in helping businesses unlock the power of AI to drive operational excellence and customer satisfaction. Our expertise in AI analytics and data-driven solutions enables us to deliver tailored solutions that meet the unique needs of our clients. Contact us to learn more about how we can help your organization achieve its goals through the strategic application of AI.
Risk and Reward: Optimizing Cut-off Points in Binary Classification
Binary classification is a cornerstone of supervised machine learning. In this domain, models often output a continuous probability score, predicting the likelihood of an outcome being positive or negative. A critical step in turning these probabilities into actionable decisions is selecting a cut-off point, the threshold at which a prediction is deemed positive (e.g., classifying a customer as likely to churn or a transaction as fraudulent).
While many organizations default to a cut-off of 0.5, this simplistic approach often overlooks the nuanced trade-offs between false positives and false negatives. To truly harness the power of machine learning, organizations must align their cut-off points with their risk appetite and the specific costs associated with errors. In this blog, we’ll explore why this alignment matters and how companies can effectively optimize cut-off points to make data-driven decisions.
Why Does the Cut-off Point Matter?
The cut-off point determines the classification boundary: probabilities above the threshold are classified as positive, while those below are negative. However, the repercussions of these decisions can vary dramatically based on the application. Misclassifications lead to either false positives (FPs) or false negatives (FNs), each with potentially significant consequences.
False Positives (FPs): When a negative case is incorrectly classified as positive. For instance, in fraud detection, this might mean flagging a legitimate transaction as fraudulent, which could inconvenience customers and damage trust.
False Negatives (FNs): When a positive case is incorrectly classified as negative. For example, failing to detect a fraudulent transaction could result in financial loss or compliance issues.
The costs of these errors are rarely equal. Depending on the context, an organization might prioritize minimizing one type of error over the other. For instance, in healthcare, avoiding false negatives (missing a disease diagnosis) often takes precedence, while in marketing, avoiding false positives (targeting uninterested customers) might be more important to reduce wasted resources.
The Role of Risk Appetite
Risk appetite is a critical factor in determining the optimal cut-off point. It reflects how much risk an organization is willing to accept in pursuit of its objectives. For example:
High-Risk Aversion: In scenarios where the cost of FNs is very high (e.g., safety-critical applications), organizations may lower the cut-off point to prioritize sensitivity and capture more true positives.
Cost Efficiency: In scenarios where FPs are more problematic (e.g., spam email detection), a higher cut-off point might be chosen to maintain precision and reduce unnecessary actions.
Aligning the cut-off point with risk appetite ensures that the model’s predictions support the organization’s strategic priorities, whether that’s minimizing costs, maximizing safety, or enhancing customer experience.
Techniques for Optimizing Cut-off Points
Cost-Benefit Analysis The simplest approach to choosing a cut-off point involves quantifying the costs of FPs and FNs and selecting the threshold that minimizes total cost. This requires assigning monetary or operational values to each type of error. For example:
If the cost of an FN (e.g., undetected fraud) is 10 times higher than the cost of an FP, the cut-off should reflect this imbalance by favoring sensitivity.
Receiver Operating Characteristic (ROC) Curve The ROC curve is a powerful tool for evaluating model performance across different thresholds. It plots the true positive rate (TPR) against the false positive rate (FPR), showing the trade-offs at various cut-off points.
Metrics like Youden’s Index (J = TPR – FPR) help identify the threshold that maximizes the difference between sensitivity and false alarm rates. It essentially indicates how far away from a random guess the test is on a Receiver Operating Characteristic (ROC) curve; a higher J value signifies better diagnostic accuracy
Alternatively, the minimum distance to (0,1) method selects the point closest to perfect classification (100% sensitivity and 0% FPR).
Precision-Recall Curve In imbalanced datasets, where one class significantly outweighs the other, precision-recall curves can be more informative than ROC curves. These curves help organizations evaluate the trade-off between precision (positive predictive value) and recall (sensitivity) to identify the most appropriate cut-off.
Custom Utility Functions For applications with unique requirements, organizations can design custom utility functions that combine the costs and benefits of true positives, true negatives, false positives, and false negatives. The cut-off point that maximizes this utility becomes the optimal threshold.
Cross-Validation for Threshold Tuning During model validation, companies often test different thresholds to find the one that delivers the best balance between FPs and FNs on unseen data. This ensures the chosen cut-off generalizes well to real-world conditions.
Domain-Specific Considerations Many industries have unique requirements or regulatory constraints that influence threshold selection:
Healthcare: Often prioritizes sensitivity to avoid missing critical diagnoses.
Finance: Often balances sensitivity and specificity to ensure compliance while minimizing operational disruptions.
Putting It All Together: Best Practices in Threshold Optimization
To effectively optimize cut-off points, organizations should adopt the following best practices:
Stakeholder Collaboration Data scientists, domain experts, and business leaders must work together to ensure the chosen threshold aligns with both technical metrics and organizational goals.
Continuous Monitoring Thresholds are not static. Organizations should regularly reassess their cut-off points to account for changes in business priorities, data distributions, or external conditions.
Consider Future Impact The chosen threshold should account for long-term implications, such as customer trust, regulatory compliance, and operational scalability.
Conclusion
Choosing the optimal cut-off point for binary classification is far more nuanced than defaulting to a probability of 0.5. It requires a deep understanding of the costs and risks associated with misclassifications, as well as alignment with an organization’s risk appetite and strategic goals. By leveraging techniques like cost-benefit analysis, ROC curves, and custom utility functions, organizations can make informed decisions that maximize the value of their predictive models.
In a world where data-driven decisions drive competitive advantage, taking the time to thoughtfully optimize cut-off points can mean the difference between success and failure. By combining technical rigor with strategic alignment, organizations can unlock the full potential of machine learning while managing risk effectively.
About VentureArmor
At VentureArmor, we specialize in helping businesses unlock the power of AI to drive operational excellence and customer satisfaction. Our expertise in AI analytics and data-driven solutions enables us to deliver tailored solutions that meet the unique needs of our clients. Contact us today to learn more about how we can help your organization achieve its goals through the strategic application of AI.
What if the cost of having machines that think, is having people that don’t? – George Dyson from the book Turing’s Cathedral
This is a relevant question from George Dyson’s master work: Turing’s Cathedral; which explores the early development of computers, nuclear weapons, AI, and more.
While this quote warns against relying too much on AI to do the thinking for us, it also brings to mind thoughtless AI implementations and the very real repercussions that can result.CIO.com recently featured an article highlighting some of these failures:
In February 2024, Air Canada was ordered to pay damages to a passenger after its virtual assistant gave him incorrect information at a particularly difficult time.
In March 2024, The Markup reported that Microsoft-powered chatbot MyCity was giving entrepreneurs incorrect information that would lead to them breaking the law.
In August 2023, tutoring company iTutor Group agreed to pay $365,000 to settle a suit brought by the US Equal Employment Opportunity Commission (EEOC). The federal agency said the company, which provides remote tutoring services to students in China, used AI-powered recruiting software that automatically rejected female applicants ages 55 and older, and male applicants ages 60 and older.
In November 2021, online real estate marketplace Zillow told shareholders it would wind down its Zillow Offers operations and cut 25% of the company’s workforce — about 2,000 employees — over the next several quarters. The home-flipping unit’s woes were the result of the error rate in the ML algorithm it used to predict home prices.
Continuing to think, while keeping a close eye on AI risk quantification, mitigation, and performance is foundational to successful AI implementations. The financial services industry has been doing it for decades. You can too.
In the rapidly evolving landscape of artificial intelligence (AI) and machine learning (ML), the governance of these models has become a critical aspect of ensuring their effectiveness, reliability, and ethical use. Proper AI builds begin with a robust definition of business requirements, recognizing that AI is a tool designed to solve specific problems. This article will explore the key steps involved in AI and ML model governance, from defining the problem to launching and monitoring the model in production.
1. Defining the Problem: The Foundation of Successful AI
The first step in any AI project is to clearly define the business problem that needs to be solved. The old adage, “a problem well defined is a problem half solved,” holds true in the realm of AI. Without a clear understanding of the business requirements, the AI model implementation is likely to be misaligned with the organization’s goals, leading to inefficiencies and wasted resources.
“A problem well stated is half solved”
Defining the problem involves several key steps:
Identifying the Business Objective: What specific business challenge are you trying to address?
Setting Clear Goals: What outcomes are you hoping to achieve with the AI model?
Understanding the Data: What data is available, and how can it be used to inform the model?
By thoroughly defining the problem, you lay the groundwork for a successful AI project. This initial step ensures that the AI tool is being used to address a real, tangible issue rather than being implemented for its own sake.
2. Choosing the Right AI Tool
Once the problem is clearly defined, the next step is to select the AI tool that best suits the task. Every AI tool has its strengths and weaknesses, and choosing the right one is crucial for the success of the project.
Supervised Learning: Ideal for problems where you have labeled data and need to make predictions.
Unsupervised Learning: Useful for identifying patterns in unlabeled data.
Reinforcement Learning: Suitable for problems where the AI needs to learn through trial and error.
Selecting the appropriate tool requires a deep understanding of the problem, the available data, and the strengths and weaknesses of various AI/ML tools. It is essential to consider the tool’s capabilities, the complexity of the problem, and the resources available for implementation.
3. Quantifying AI Risk
After defining the AI approach and selecting the appropriate tool, the next step is to quantify the risk associated with the AI model build. AI Risk Assessment is a multifaceted process that considers various factors, but much of it relates to the implications of incorrect or erroneous answers from the system.
Data Quality: The quality and reliability of the data used to train the model.
Model Accuracy: The likelihood of the model producing accurate predictions.
Ethical Considerations: The potential for the model to produce biased or unfair outcomes.
Other Factors
Risk assessment helps to identify potential issues early in the process, allowing for mitigation strategies to be put in place. This step is crucial for ensuring that the AI model is not only effective but also ethical and reliable.
4. Model Construction and Validation
With the problem defined, the tool selected, and the risks quantified, the next step is to construct and validate the model. This involves several key activities:
Data Preparation: Cleaning and preprocessing the data to ensure it is suitable for training the model.
Model Training: Using the prepared data to train the AI model.
Validation: Testing the model with a separate dataset to ensure it performs as expected.
Validation is a critical step in the process, as it helps to identify any issues with the model before it is deployed. This ensures that the model is robust and reliable, capable of producing accurate and consistent results.
5. Launching and Monitoring the Model
The final step in the AI model governance process is to launch the model into production and monitor its performance. This involves several key activities:
Deployment: Integrating the model into the organization’s systems and workflows.
Monitoring: Continuously monitoring the model’s performance to ensure it is operating as expected.
Maintenance: Regularly refitting and rebuilding the model to account for changes in the data or business requirements.
Monitoring is an ongoing process that ensures the model remains effective and reliable over time. It allows for the early detection of issues, enabling timely interventions to maintain the model’s performance.
Conclusion
AI and machine learning model governance is a complex but essential process that ensures the effective and ethical use of these powerful tools. By defining the problem, selecting the right tool, quantifying the risk, constructing and validating the model, and launching and monitoring it in production, organizations can harness the full potential of AI while mitigating the risks associated with its use. Proper governance is not just a best practice; it is a necessity for any organization looking to leverage AI to drive innovation and growth.
VentureArmor: Here to Help
VentureArmor’s AI/ML Risk Audit Services are here to help. Whether your company needs AI/ML risk assessment and mitigation capabilities built from the ground-up, or you need an independent audit of your existing capabilities, the industry experts at VentureArmor are here to help. With decades of experience implementing best-in-class compliant AI solutions in Financial Services, Supply Chain, and Healthcare, our expertise covers:
AI Model Risk Assessment & Tiering Frameworks
AI Model Build Standards
AI Model Documentation Standards
AI Governance Council Formation and Management
AI Model-Ops Best Practices
US and International Data and AI Compliance Consultation (US and EU)